Every loss, published.
The numbers a highlight reel can't fake
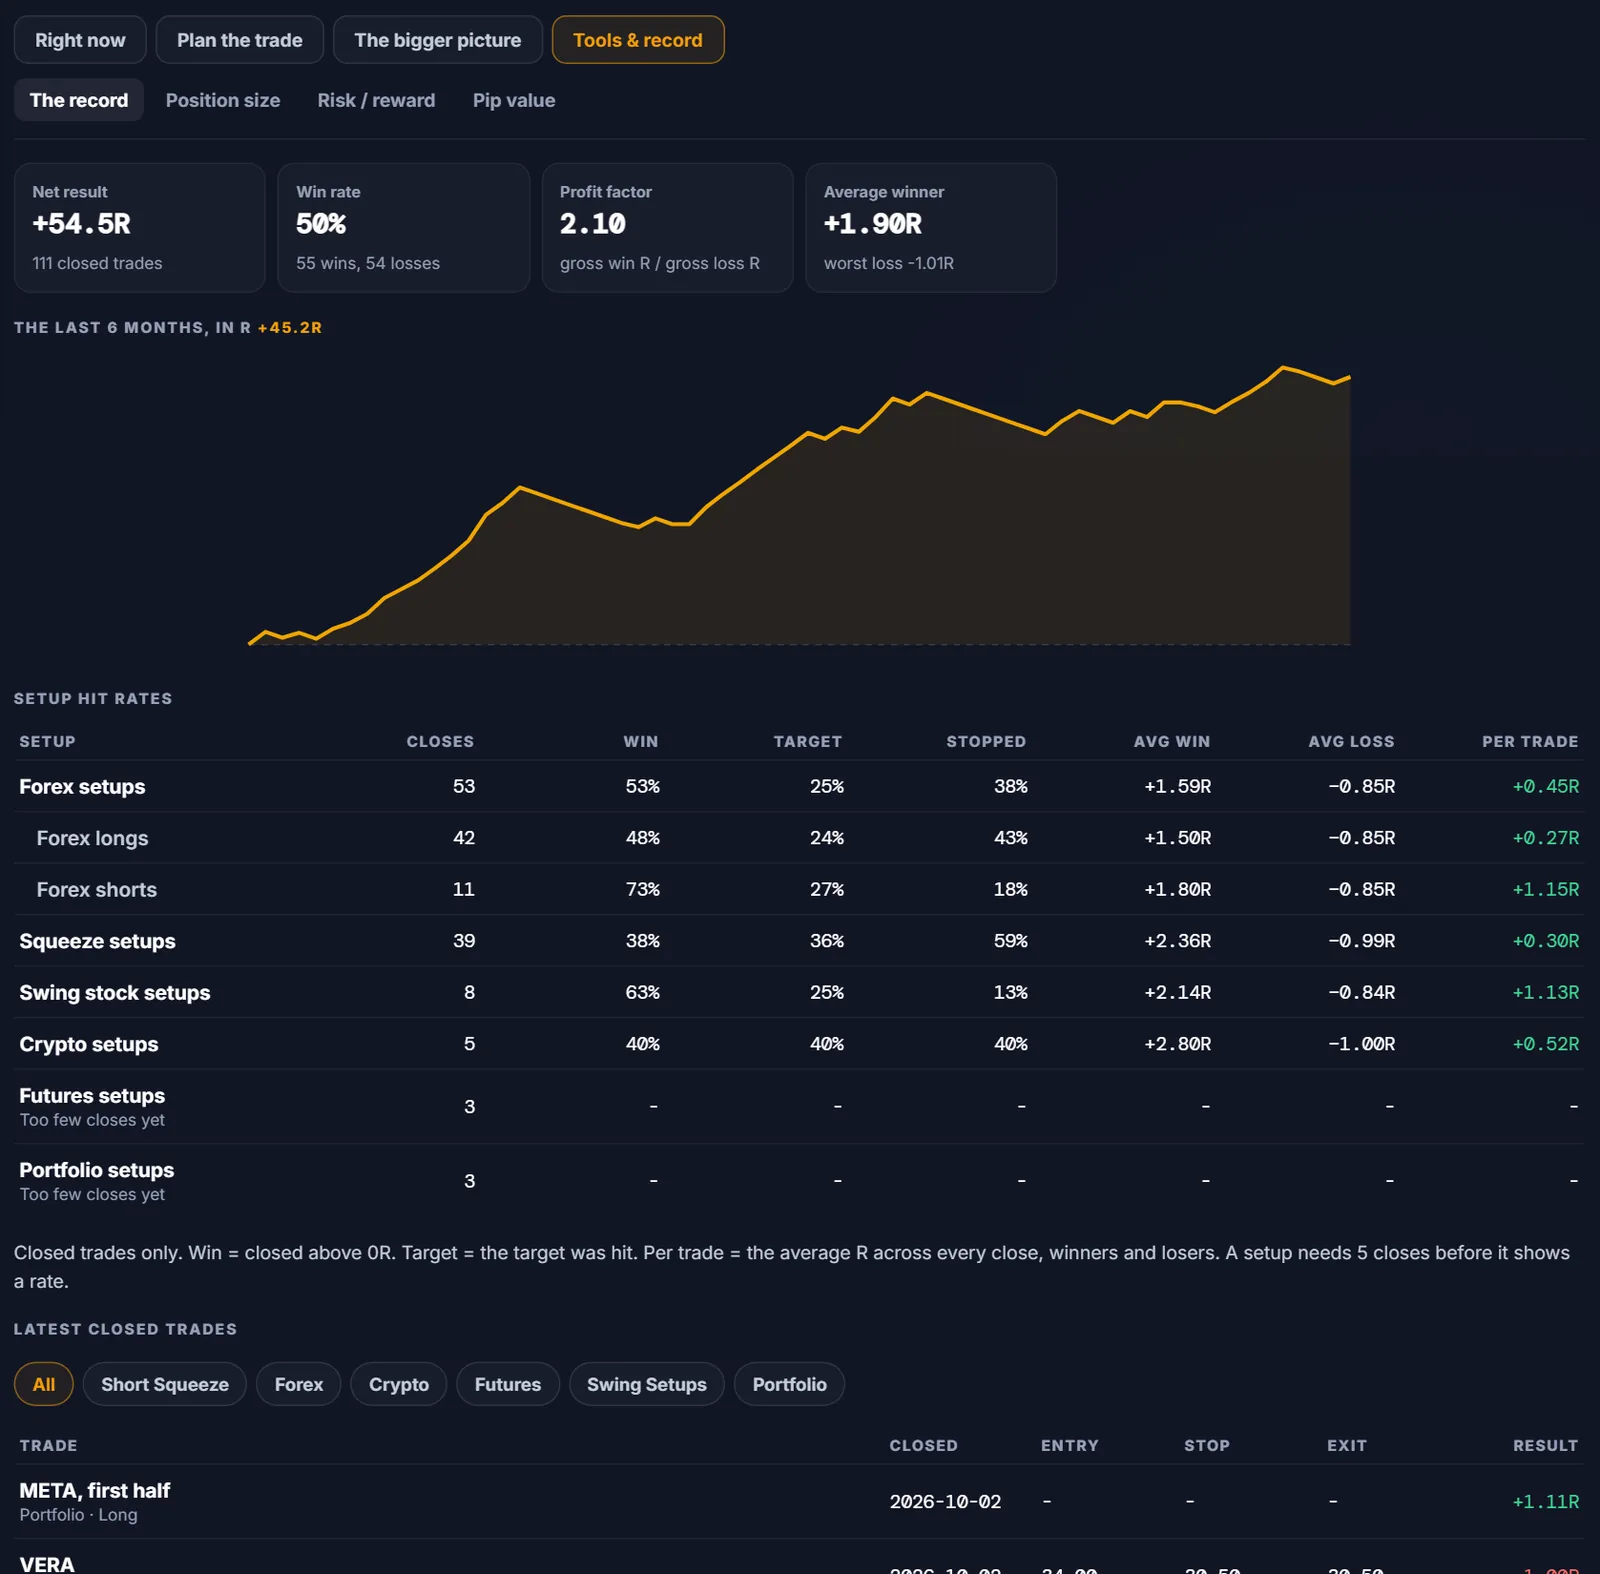
Read those four numbers together and you have the whole system. The average winner makes roughly twice what the average loser costs. That asymmetry, not a sky-high win rate, is why the record compounds: at a 2:1 payoff, even winning barely half the time is decisively profitable. The win rate here is 47%.
The number that matters most on this page is the last one. In 118 published trades, no loss has ever exceeded −1.01R, one hundredth past the planned risk, which is ordinary fill slippage, not a blown stop. Losing trades are not a failure of the system. They are the system, working.
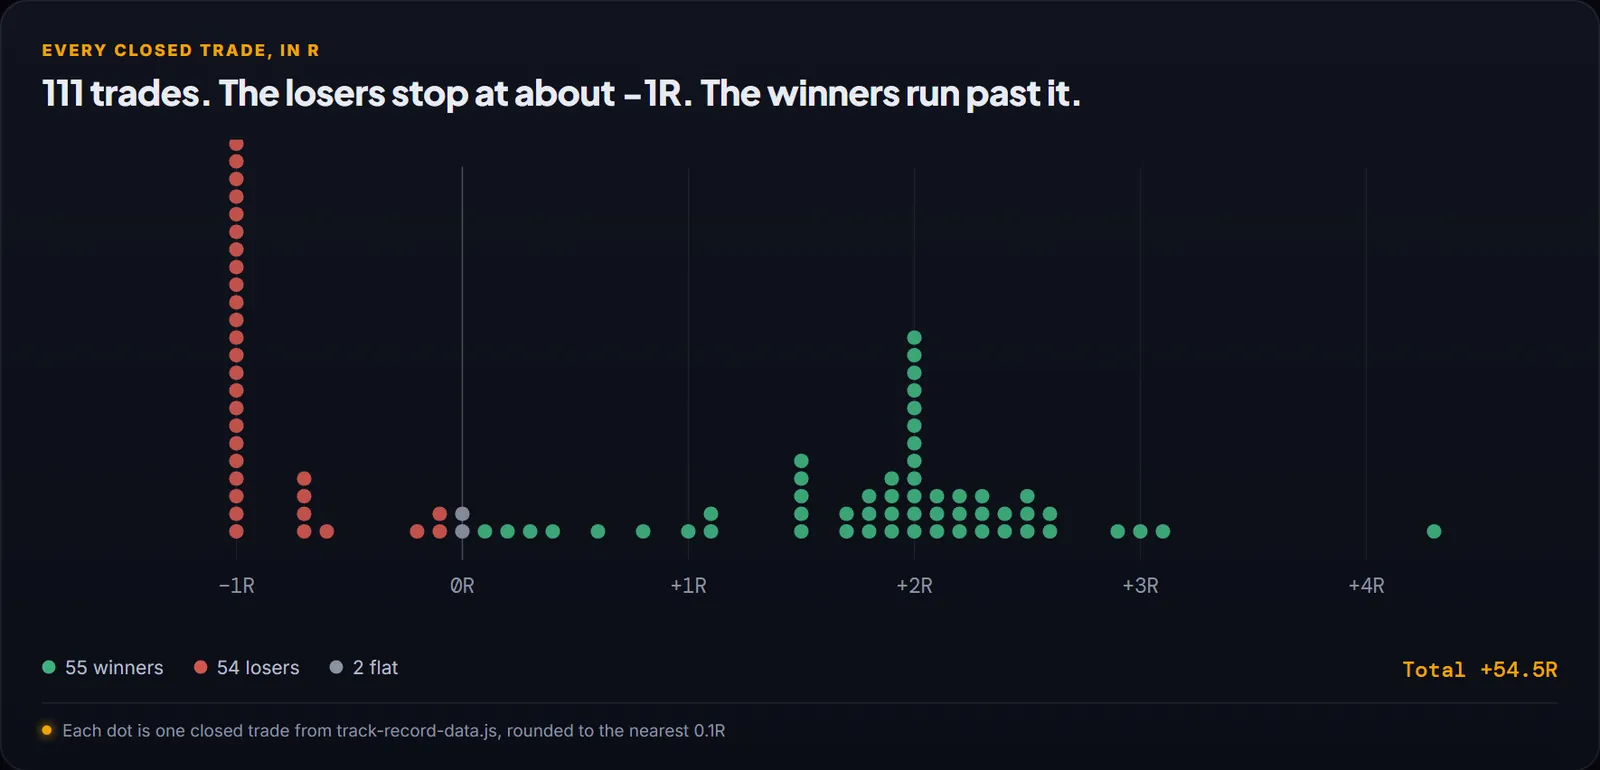
The wall at −1R
This shape is what risk control looks like when you can see it. If stops were being widened, moved, or ignored "just this once", red bars would leak past −1R, one bad habit is all it takes. 31 of the 60 losses are full stops at approximately −1R; the rest were closed early for smaller losses. Nothing beyond the wall.
What a full stop actually looks like
Take a real one from the table below: a GBP/CAD long that hit its stop for −1.01R, the single worst outcome in the entire published record. The trade was planned with the stop decided before entry, the position sized so that stop equalled about 1% of account risk, and when price came for the level the trade was closed and logged. No widening the stop, no averaging down, no "give it room".
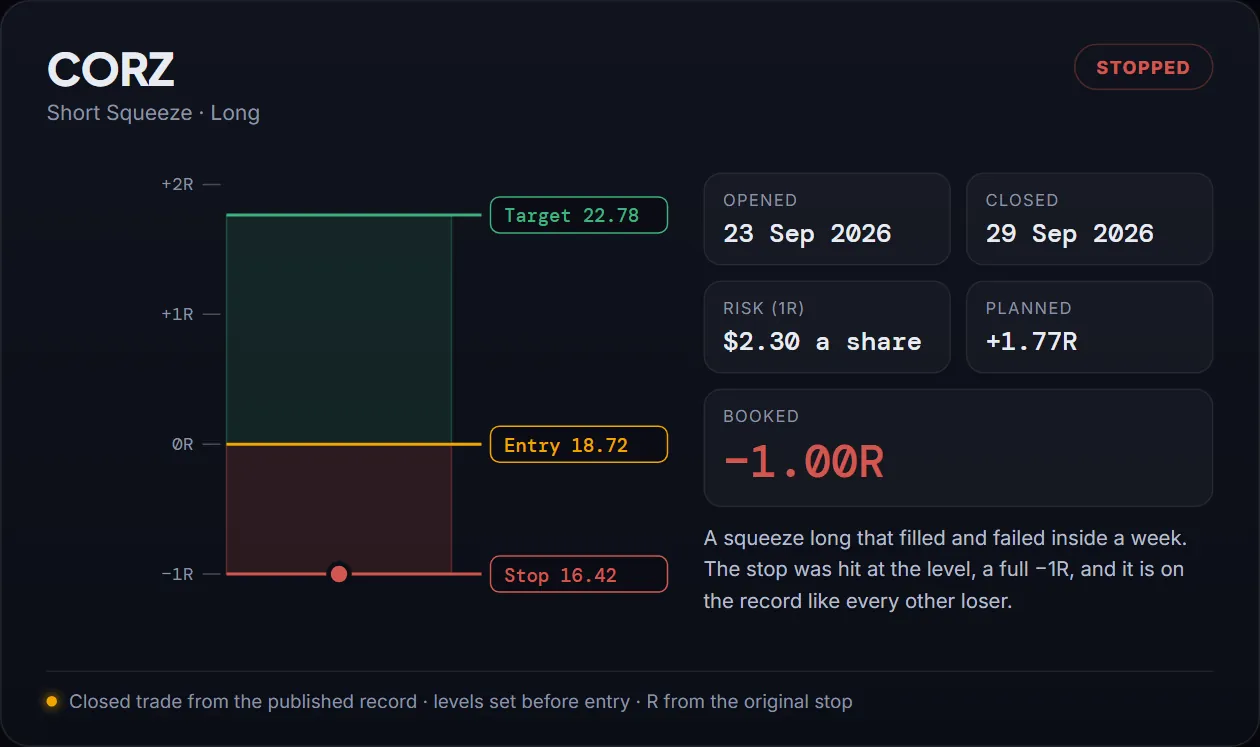
Risking 1%, it cost 1%. Then the next trade was taken. Multiply that discipline across every loss on the record and the damage stays small enough that the winners, which run about twice as far as each loss, produce a strongly positive record. That is the entire pitch of loss containment: you cannot avoid losing trades, but you can decide in advance what each one is allowed to cost.
The full list
Every losing trade on the published record, most recent first. The same trades appear in context, alongside the winners, on the full track record.
| Asset | Type | Direction | Closed | Result |
|---|---|---|---|---|
| Loading the record… | ||||
The setups behind this record are published every Sunday
Analysed swing setups across stocks, forex and crypto with the exact entry, stop and target decided before the open, the same discipline this page documents, applied forward.
Get this week's setups118 trades · winners and losers · +50.5R see the full record →
FAQ
Do trading signal services lose money on trades?
All of them do, the honest question is how much each loss costs. Here, 60 of 118 closed trades lost, the average loss was −0.93R against an average win of +1.90R, and the worst single loss was −1.01R. The record is profitable because losses are capped near one risk unit while winners run about twice as far. Any service that shows you only winners is answering a different question.
What does a −1R loss cap mean in practice?
R is the amount you planned to risk, the distance from entry to stop, in money. A −1R cap means the stop is decided before entry, the position is sized from it, and the stop is honoured. A losing trade then costs about one planned risk unit, no more. The full mechanics are in how to set a stop-loss and what is an R-multiple.
Why publish the losing trades at all?
Because the losers are what make the rest of the record believable. A win rate you can't audit is marketing; 36 published losses with dates and R outcomes make the profit factor and expectancy checkable by anyone. It also shows what a subscriber is actually buying, not loss avoidance, which no honest service can sell, but loss containment.
How do I cap my own losses at −1R?
Three habits: decide the stop before entry and size the position from it (a fixed fraction of the account, commonly 1%); place the stop as a real order, not a mental level; and never widen it once in the trade. A position size calculator does the arithmetic in seconds.