RB Trading
Loading this week’s setups…
EUR/USD ▲ 0.12%
GBP/JPY ▼ 0.08%
XAU/USD ▲ 0.31%
NAS100 ▲ 0.22%
CAD/CHF ▼ 0.15%
EUR/CHF ▲ 0.09%
RB Trading
Not AI A funded trader

Stop hunting setups.Get the plan.

Every trade clears The 3-Gate System — Trend, Momentum, Risk — so you only trade what's already lined up. Exact entries, stops and targets across 100+ markets, mapped by a funded trader before Monday open.

Recent Member Wins
Get this week’s setups From 55¢ a day — $199/yr with 20% off launch · cancel anytime
One subscription unlocks it all: the live Trade Desk, Inside the Trade (2 letters a week), the TradingView indicator suite and the masterclass library. Instant access, cancel anytime.
86 closed trades39 losers shown+51.8R totalprofit factor 2.46worst loss −1.01Revery level published in advance 86 closed trades39 losers shown+51.8R totalprofit factor 2.46worst loss −1.01Revery level published in advance Full record →
★★★★★
Trusted by 7,000+ traders
Already subscribed?
100+
Markets
Pre-set
Entries
890+
Assets
Mon
Weekly
Live app · silent preview
Called in advance · then it played out

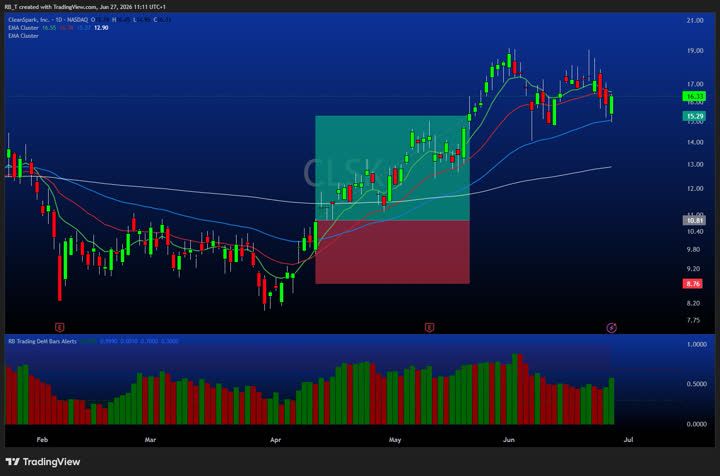
The level was on the chart before price got there.

Every setup is mapped with the entry, target and stop drawn ahead of the move. Watch a real one fill — the exact thing members get before Monday.

Human intelligence

No algorithm calls your setups.
A funded trader does.

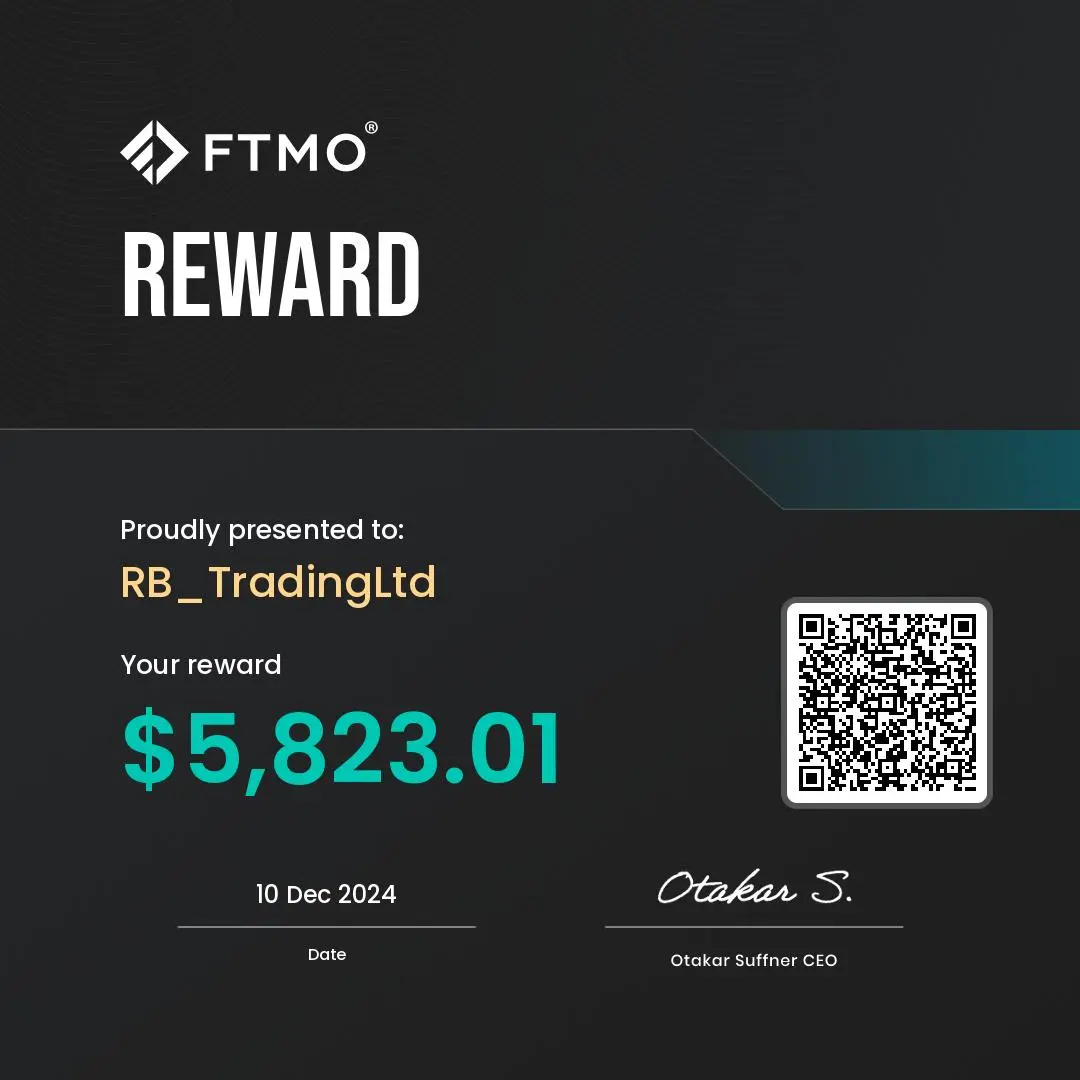
Every trading tool spent the last two years bolting on AI. We didn't. A real trader with verified prop firm payouts maps every market by hand before Monday open — then trades the same levels you get. And the proof is public: 86 closed trades on the record, 39 losers shown, +51.8R total.

Nathan — RB Trading
Run by Nathan · RB Trading21,000+ followers
Funded swing trader. Every call is published before the open and stays up whatever happens next — the losses included. The letters are written with his partner behind MTS.
X · 7,000+ Instagram · 4,000+ Medium · 1,700+ MTS on X · 9,000+

You know how to trade.
You just don't have a plan.

01
Whole weekend on charts. Still unsure Monday morning.
You scan every market, check every timeframe. Price moves while you're still deciding what to trade.
02
Setup forms. You hesitate. 300 pips gone without you.
You saw it — but had no pre-set level. So you FOMO in at the top instead of entering at the plan.
03
Your winner turns into a loser. No exit plan.
You hold too long, give profits back, close breakeven. The market gave — then took it back because you had no rule.
The plan
Every open trade carries its entry, stop and target — set before the week starts, not after price moves.
The RB Trading Blueprint

Every trade clears
The 3-Gate System.

No setup reaches your dashboard until it passes all three gates. Miss one and it's cut — that's how a weekend of charts becomes a two-minute plan.

Gate 01
Trend
The higher-timeframe trend has to line up first — EMA structure confirmed (50 above 200, price respecting the levels). We trade with the tide, never against it.
Gate 02
Momentum
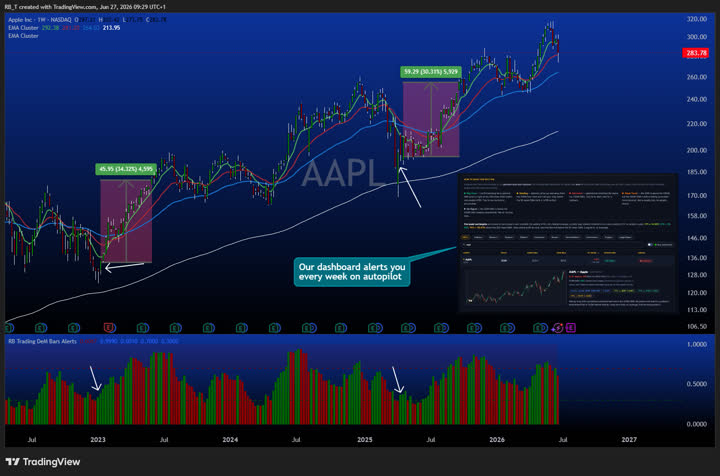
The DeMarker signal must agree — momentum turning from a reset, not chasing an exhausted move. This is the timing gate that keeps you out of tops.
Gate 03
Risk
Every trade ships with a hard stop and scale-out targets set before entry. If the risk isn't defined and the reward isn't worth it, the setup never makes the list.
One system · every market
Long-term investing Day-trade ideas Swing setups Short-squeeze plays Short-float rockets EMA + DeMarker forex Stock intel
Mapped by hand
Levels and zones drawn on the chart — the same ones you get, before Monday open.

Everything. Every Monday.

EMA Swing Setups
Large-cap stocks and crypto. Daily chart setups with exact entries, stops and scale-out targets.
Forex EMA + DeMarker
Trend + momentum trading on the major pairs — 50/200 EMA levels confirmed by the DeMarker signal. Know exactly where to watch before the week opens.
Short Squeeze Watchlist
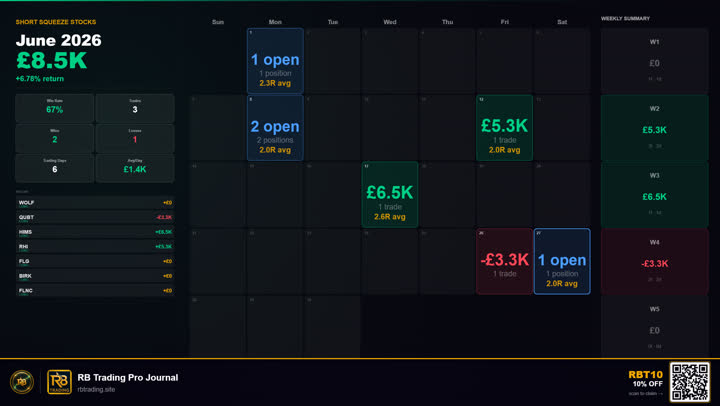
High short-interest stocks with squeeze potential. Updated weekly with exact setup criteria.
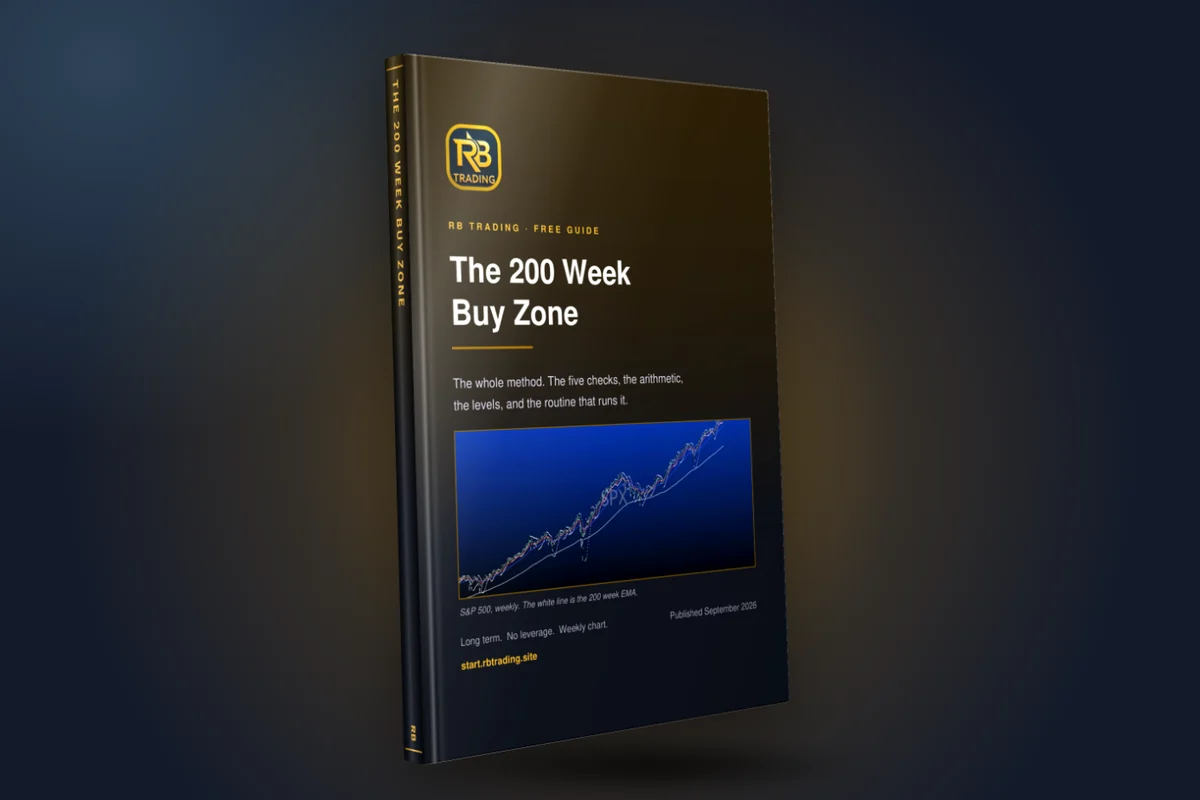
200W Buy Zones
890+ assets auto-tracked on the weekly chart — plus look up thousands more on demand. Know when a blue-chip asset is genuinely cheap.
Live Trigger Watch
Real-time alerts when a setup triggers. Break-above vs close-above tracked precisely.
Example Trades
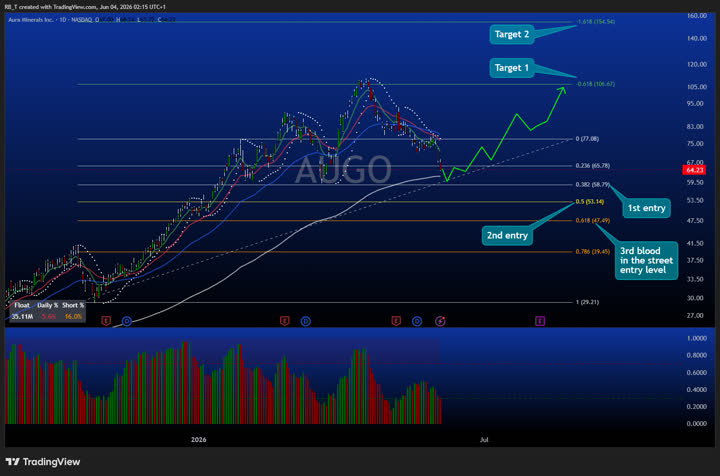
Every setup shown with a real annotated chart. Know exactly what the pattern looks like.
One subscription · the whole system

The Desk is only half of it.

One subscription doesn't buy an app — it buys the full RB Trading system: this week's plan, the education behind it, and the tools to execute it.

The app

The Trade Desk

  • The full week's plan, live every Sunday
  • Live Trigger Watch + email alerts when trades fire
  • Short squeeze watchlist — 20+ stocks pre-screened every Monday
  • 200-week Portfolio Builder across 890+ assets
The education

Inside the Trade

Two letters every week — over 100 a year. The full reasoning behind the trades, trading psychology, risk, and building income that lasts. Recent letters:

  • "You Did Not Lose Money This Week. Your Stop Loss Made You Money."
  • "Why Green Days Are More Dangerous Than Red Ones"
  • "The Five Minute Chart That Prints Three Times a Week in New York"
Read a full letter free →
TradingView indicator suite4 invite-only algos: NY Volume Momentum · DeM Trend Bias · 4H JRSX · 15M Swing Structure
Masterclass library20+ lessons and growing — psychology, risk, macro, prop-firm prep, beginner to funded
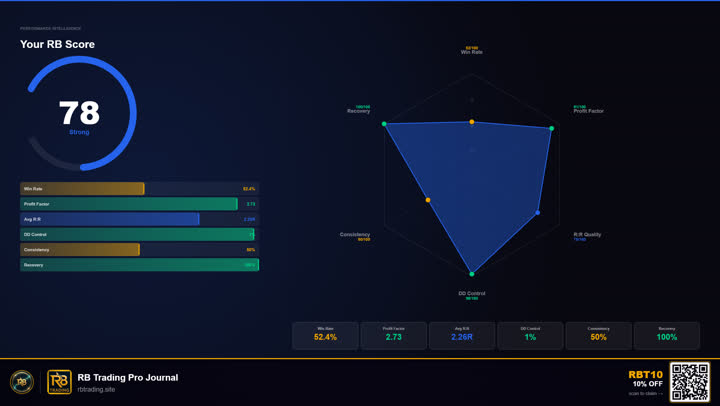
Member perksthe Pro Journal at your member rate, prop-firm discounts and more subscriber-only deals
890+assets auto-tracked
100+letters a year
20+masterclasses
4TradingView tools
890+ assets scanned
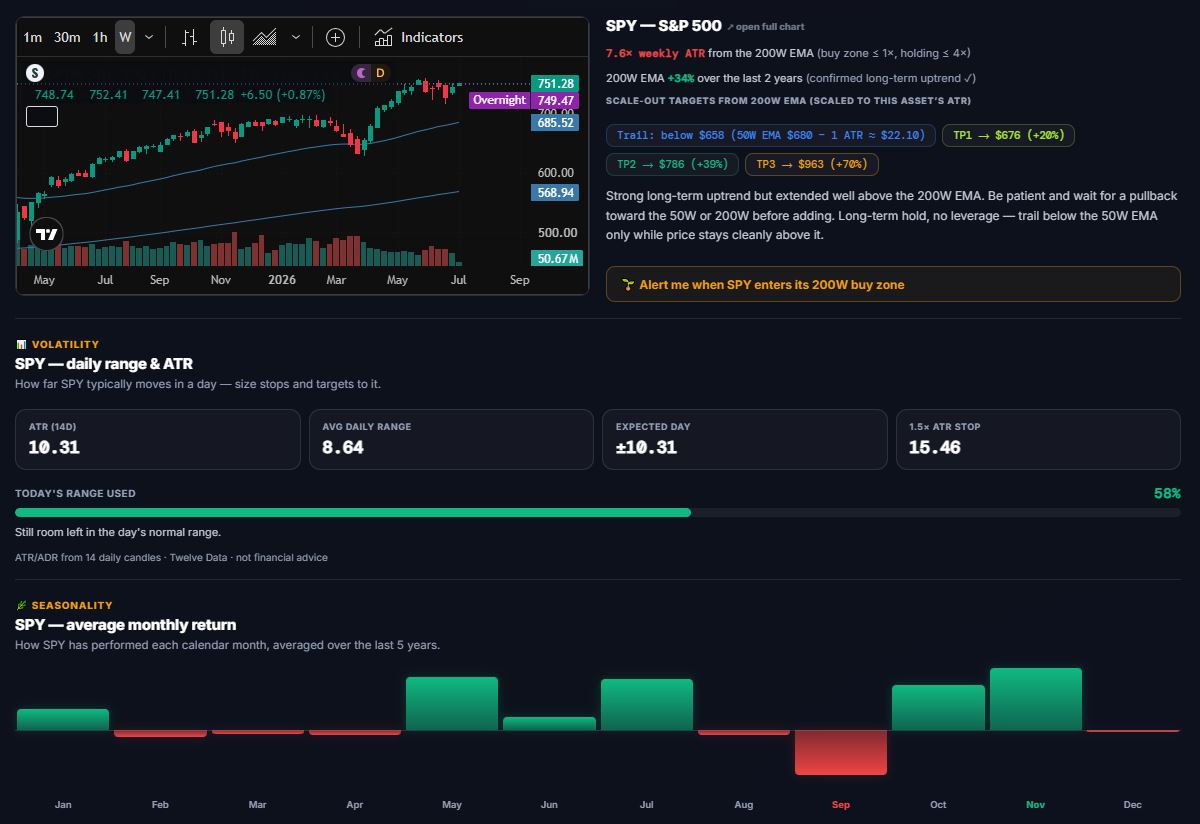
The Portfolio Builder ranks every market against its 200-week EMA and flags the ones in a buy zone.
Look inside

This is the actual desk.

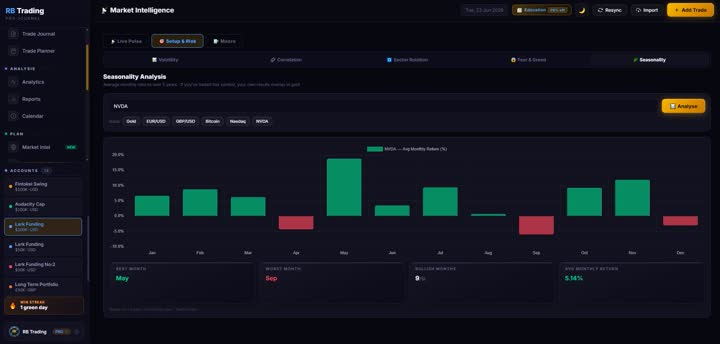
Not mock-ups — real screens from inside the members' area. Weekly setups, live triggers and the 200-week buy-zone builder.
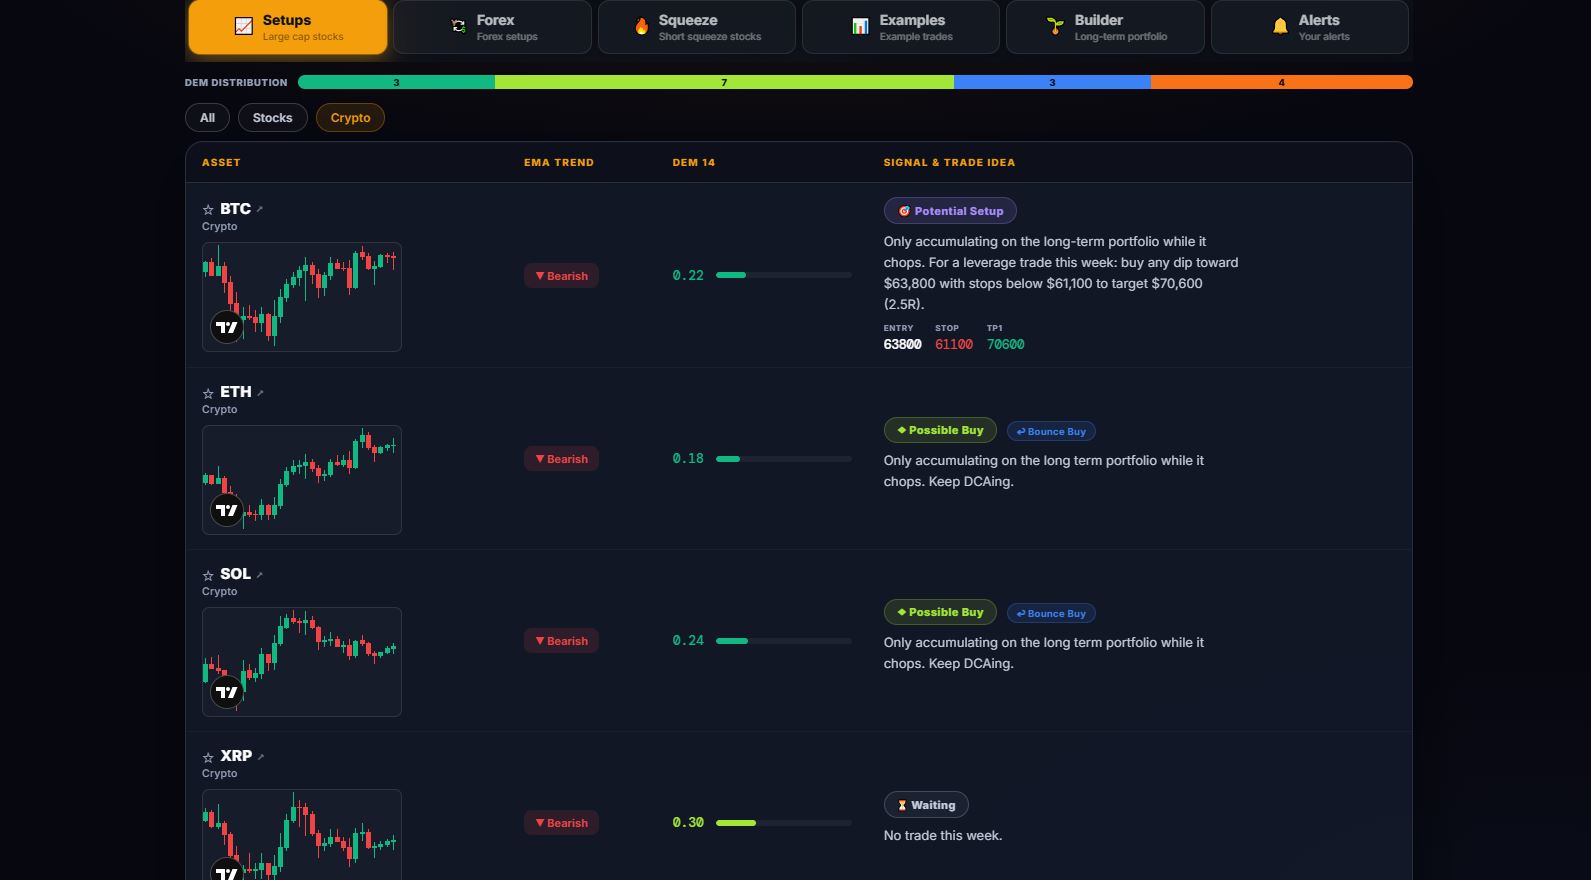
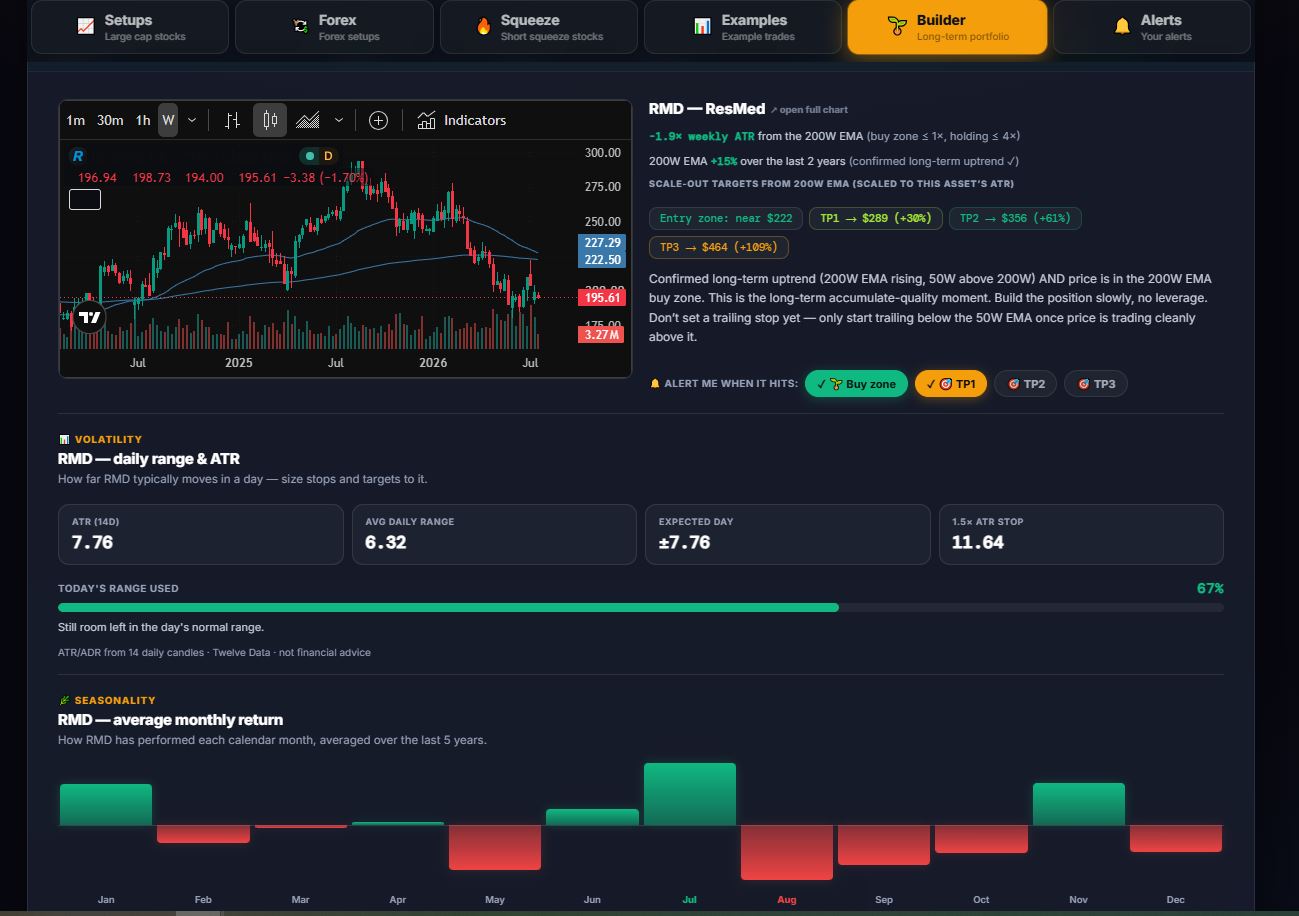
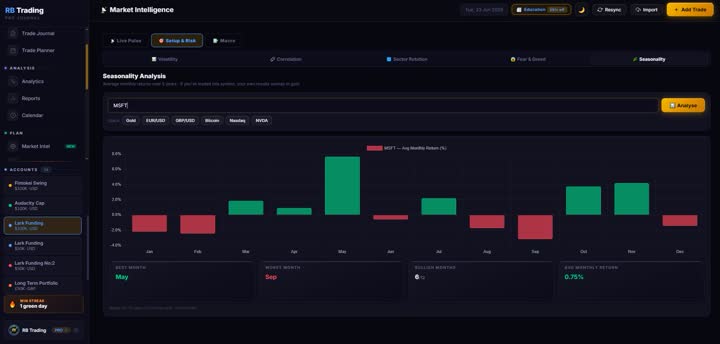
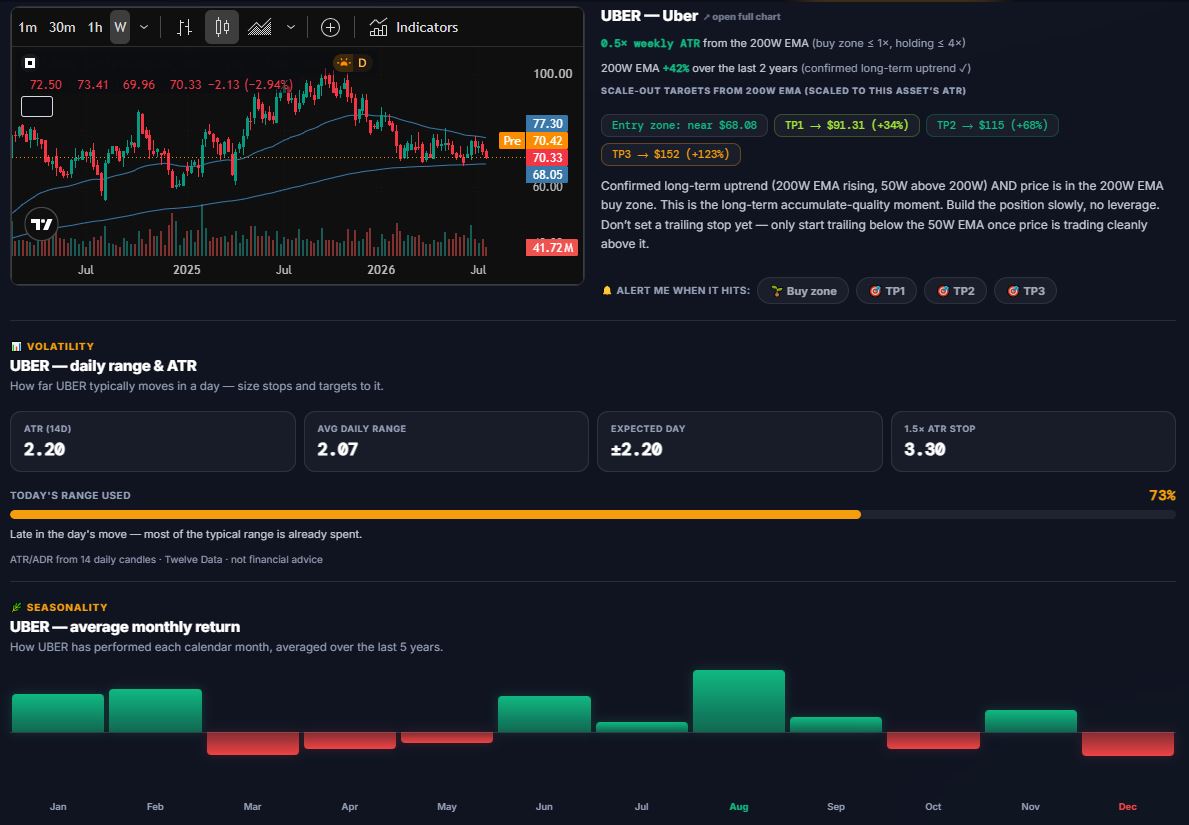
Weekly setups list 200-week buy-zone builder with alerts SPY scored against its 200-week EMA Scale-out targets on a position Volatility and seasonality panels Daily range and ATR to size stops The long-term accumulate plan
Weekly SetupsEvery large-cap and crypto scored by EMA trend and DeMarker, with the exact entry, stop and target already mapped.
Real trades

The system, in the wild.

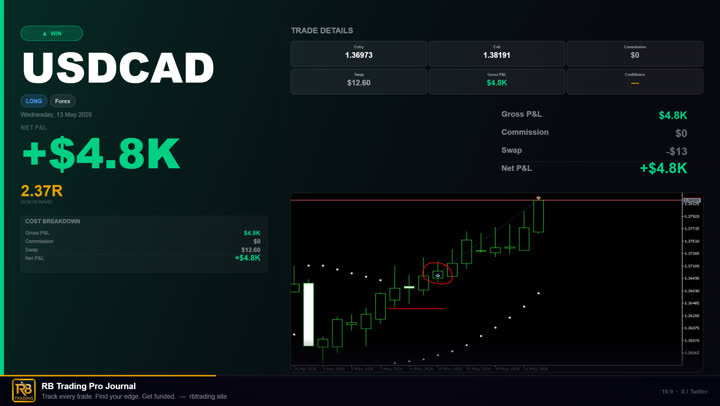
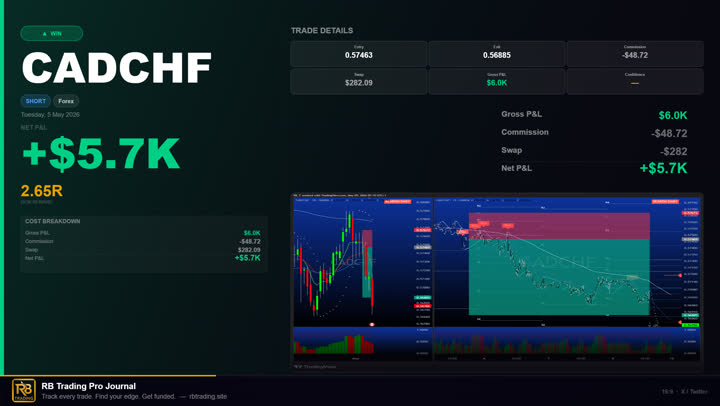
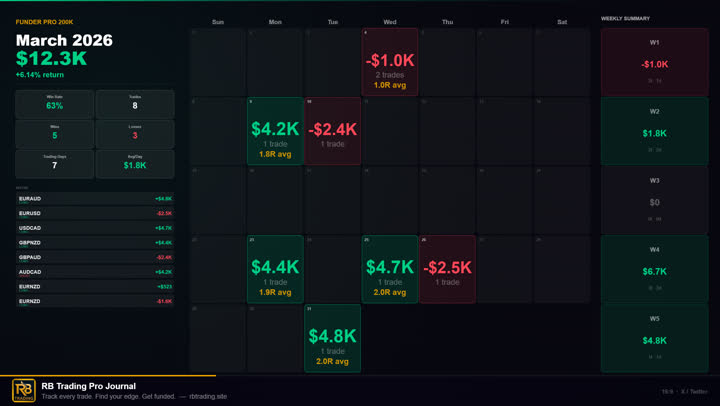
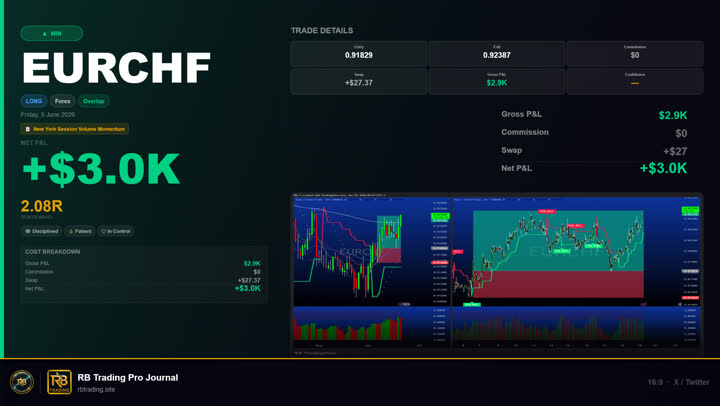
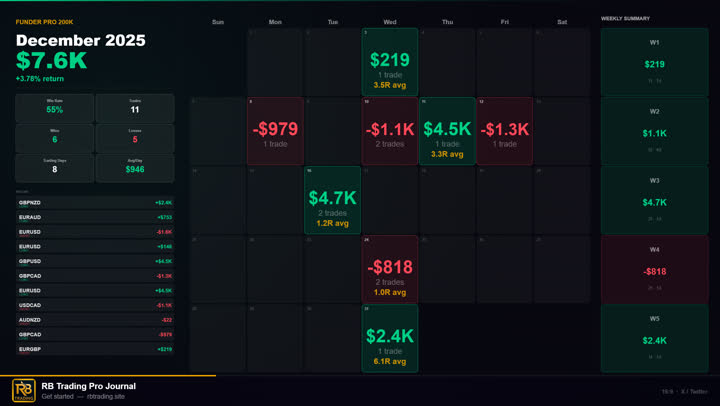
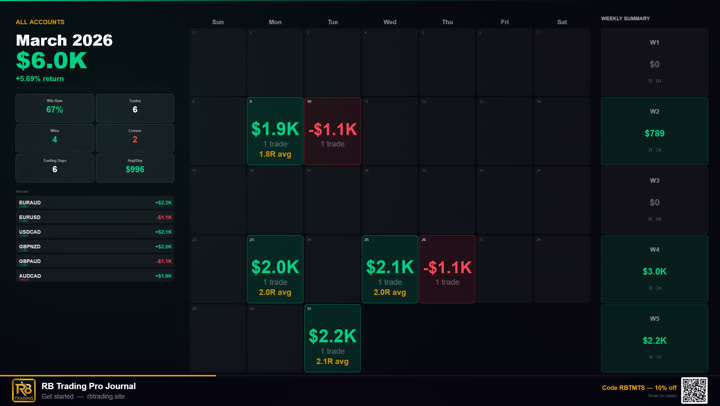
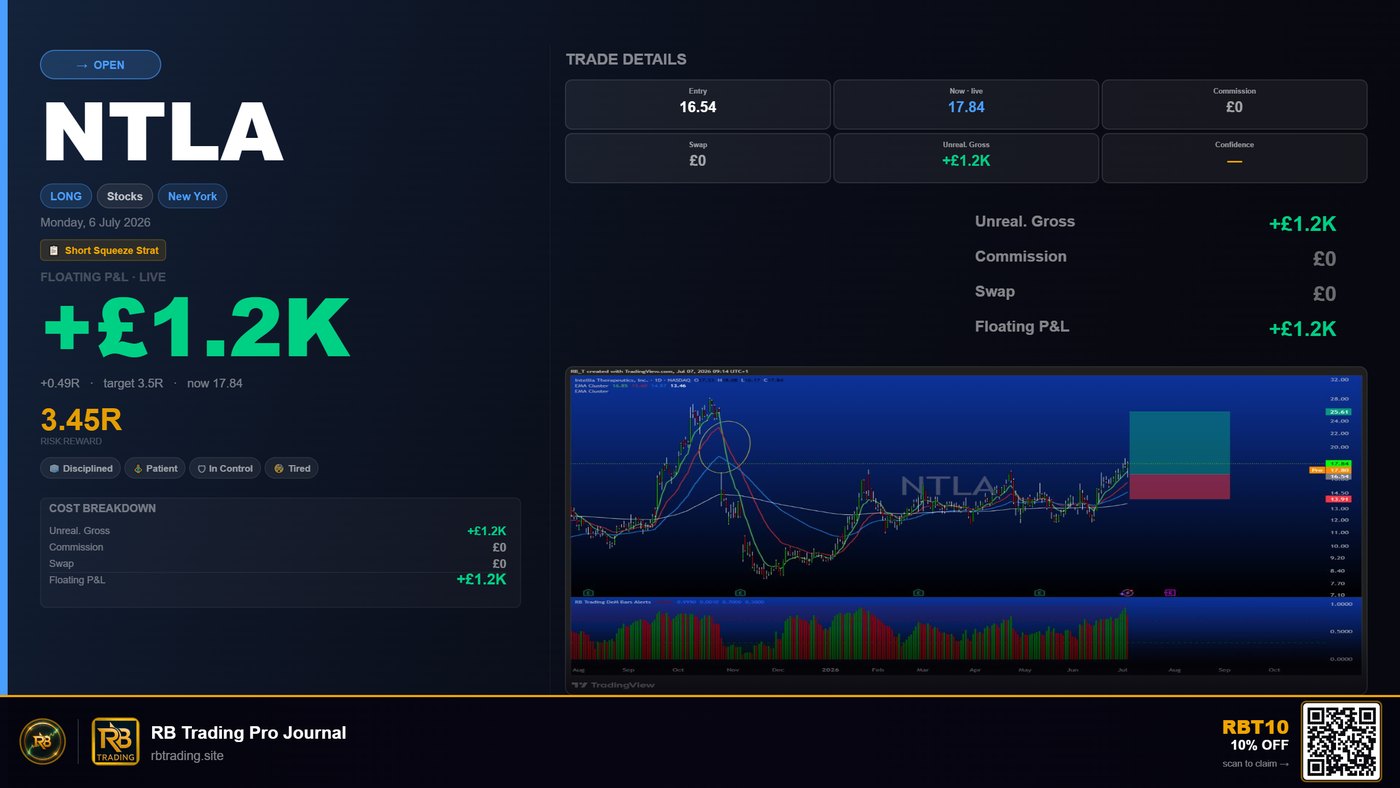
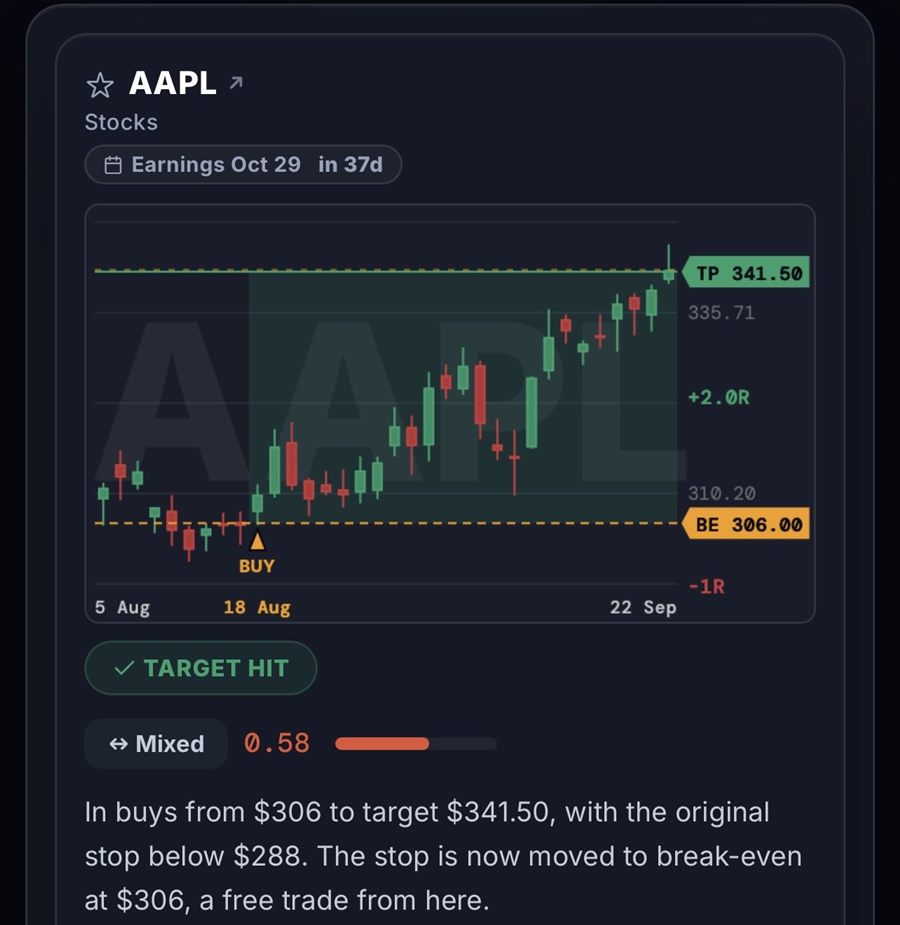
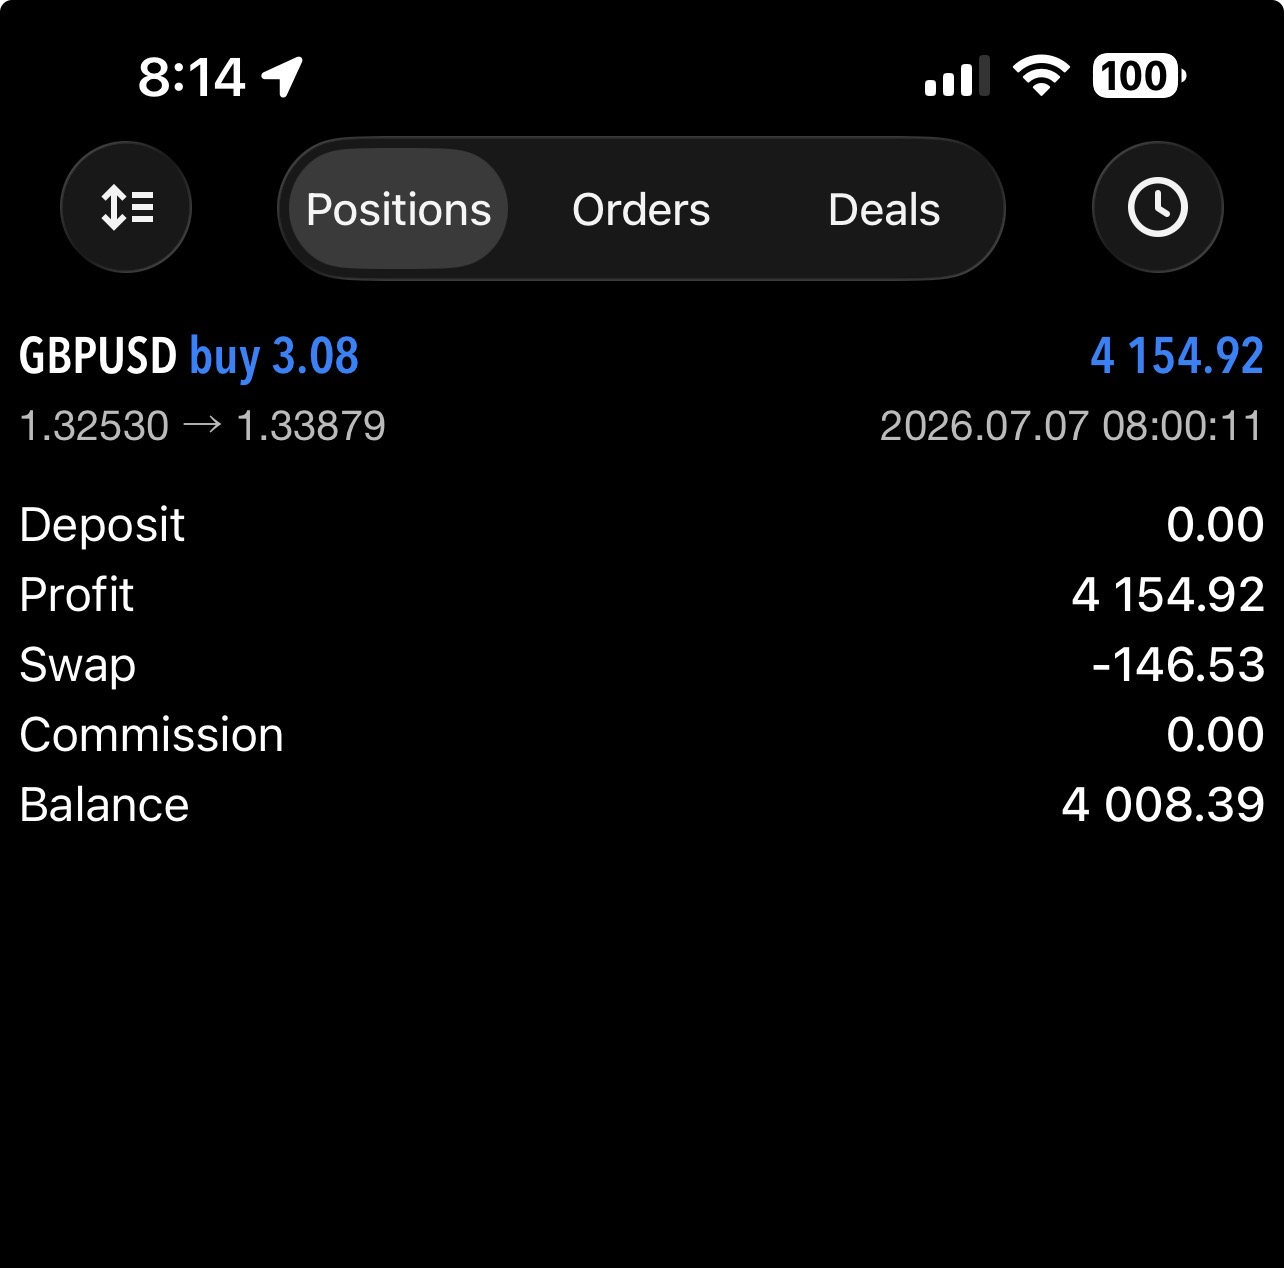
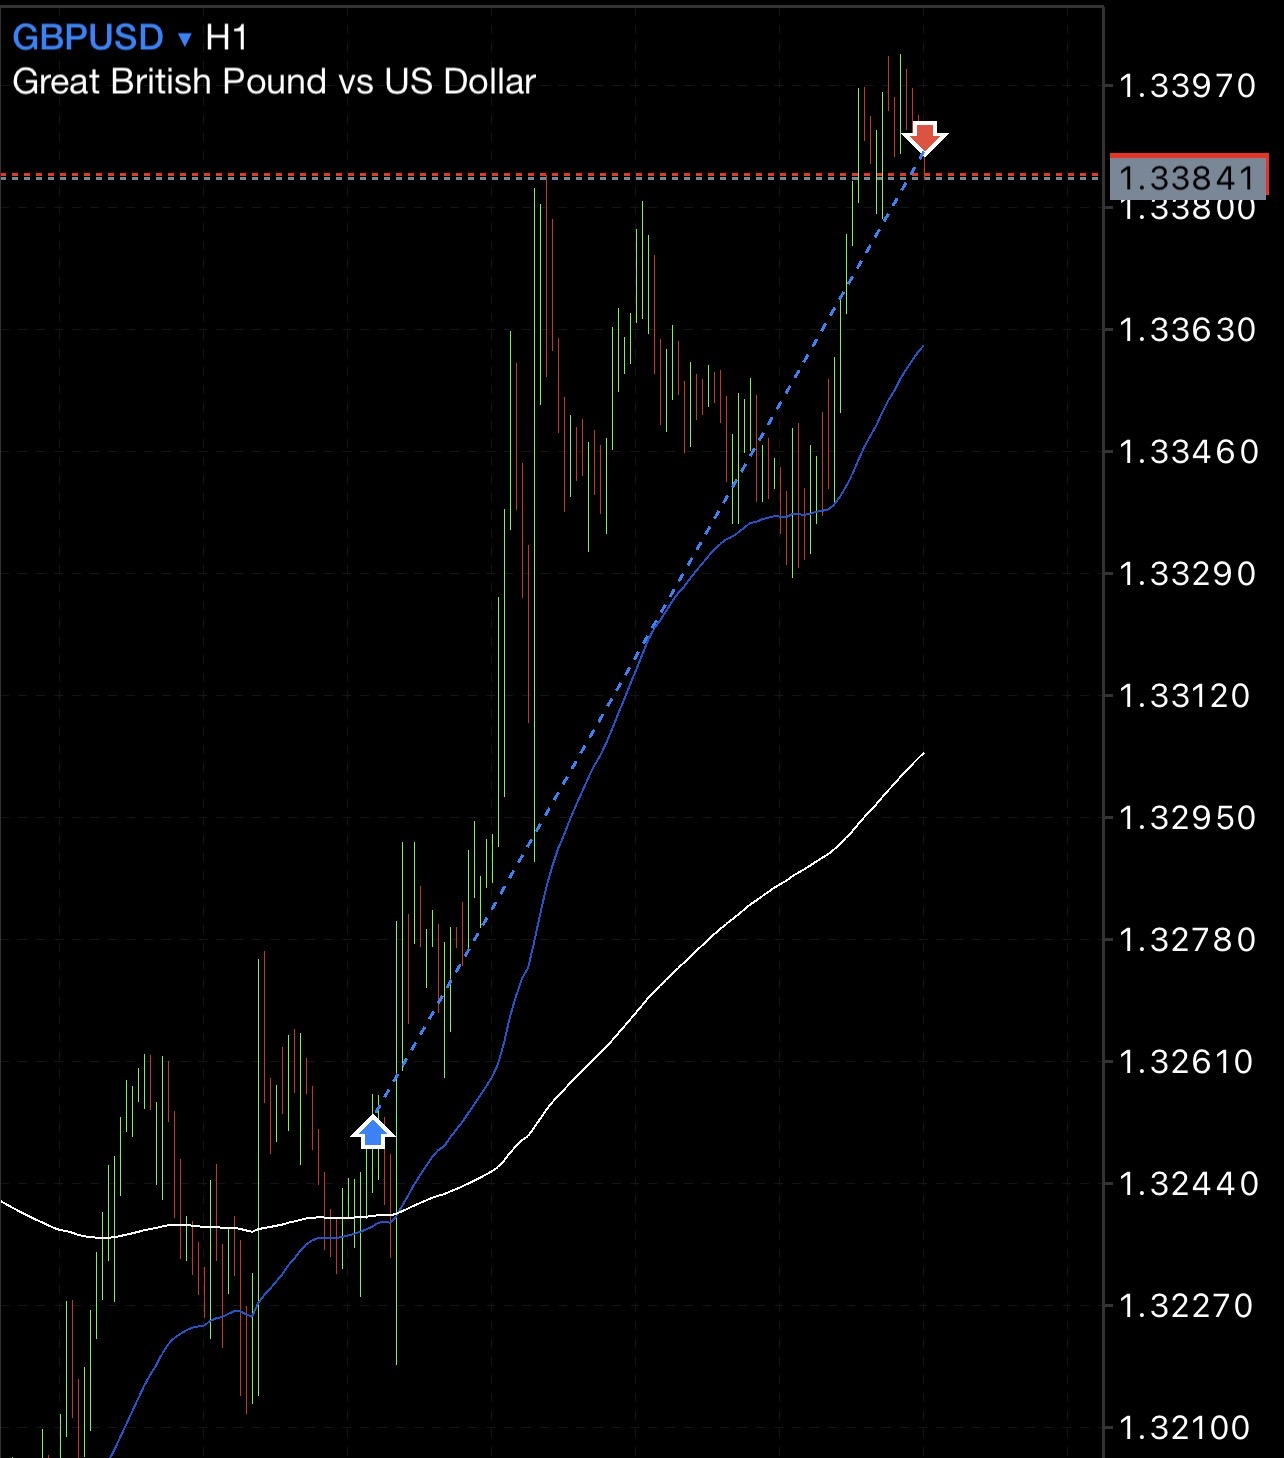
Trades taken from the desk's own levels — logged in the RB Trading journal and on the broker.

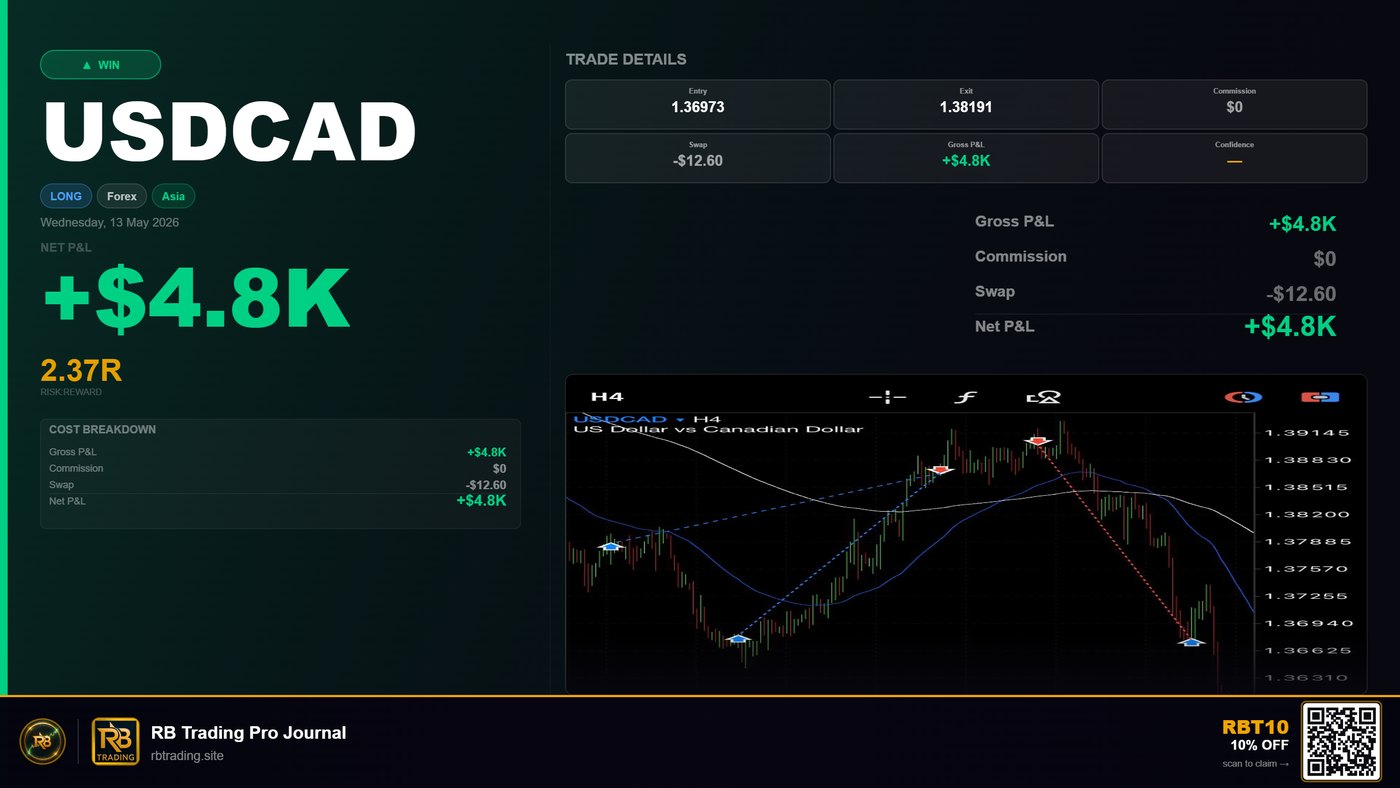
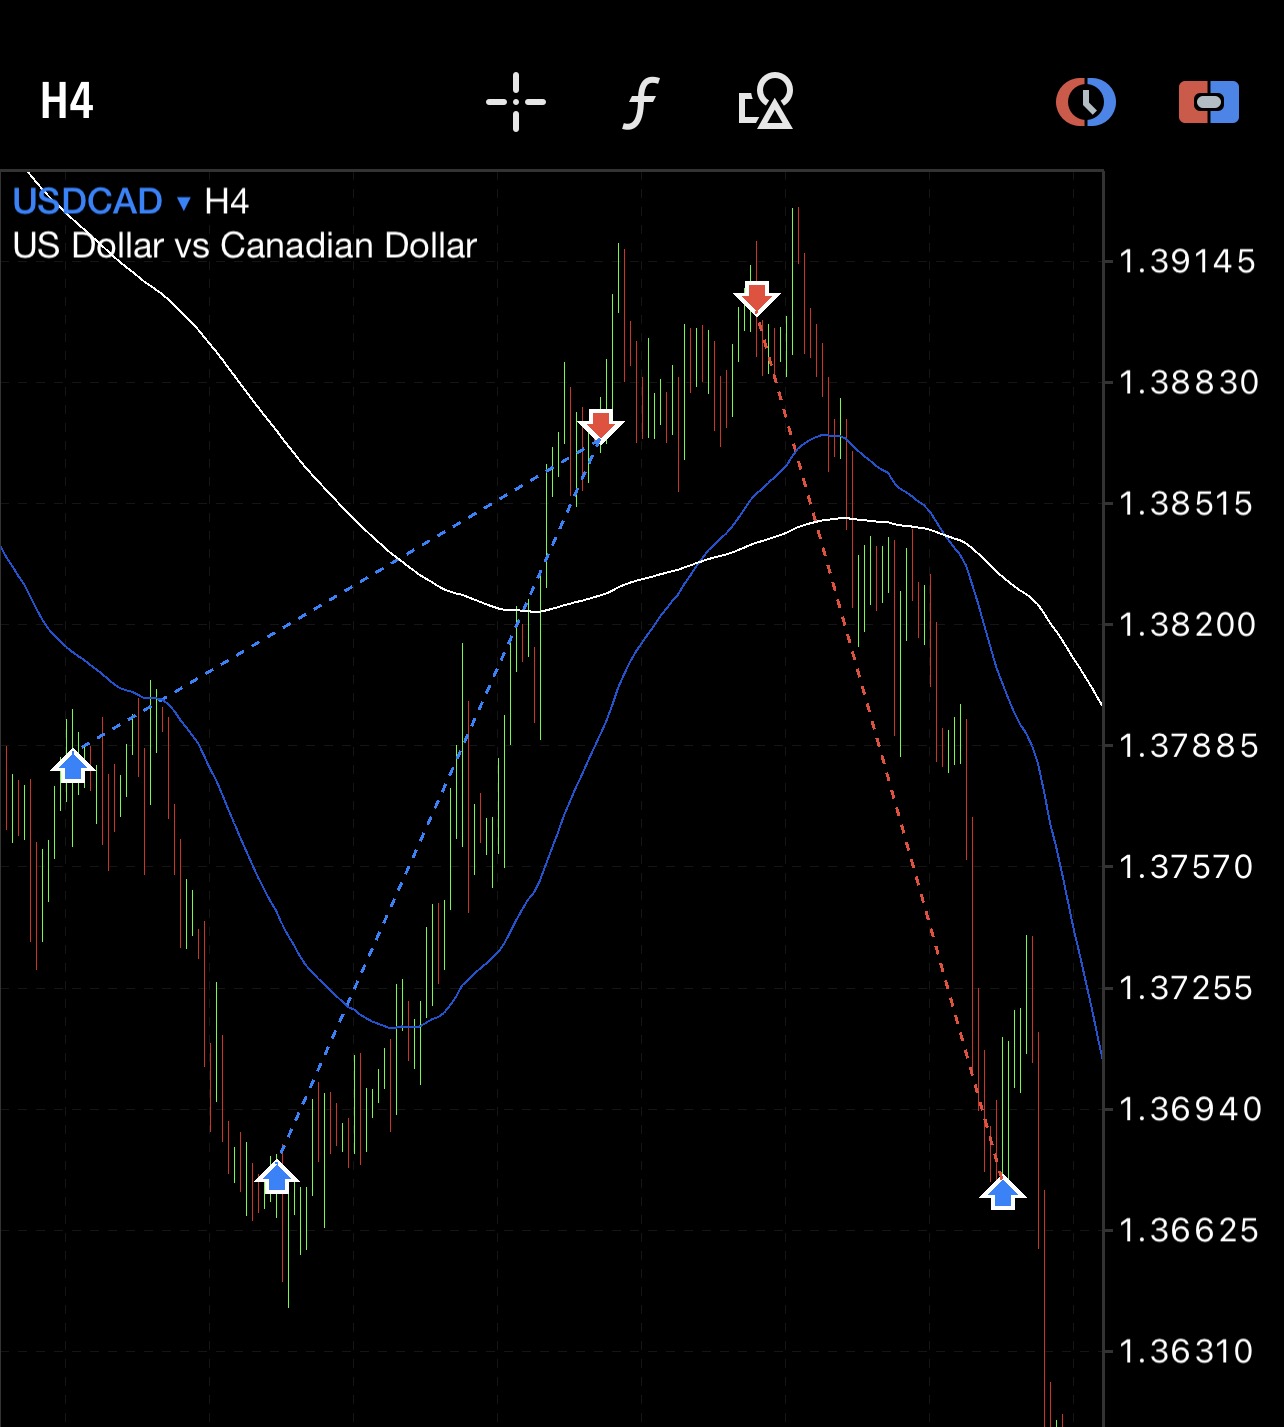
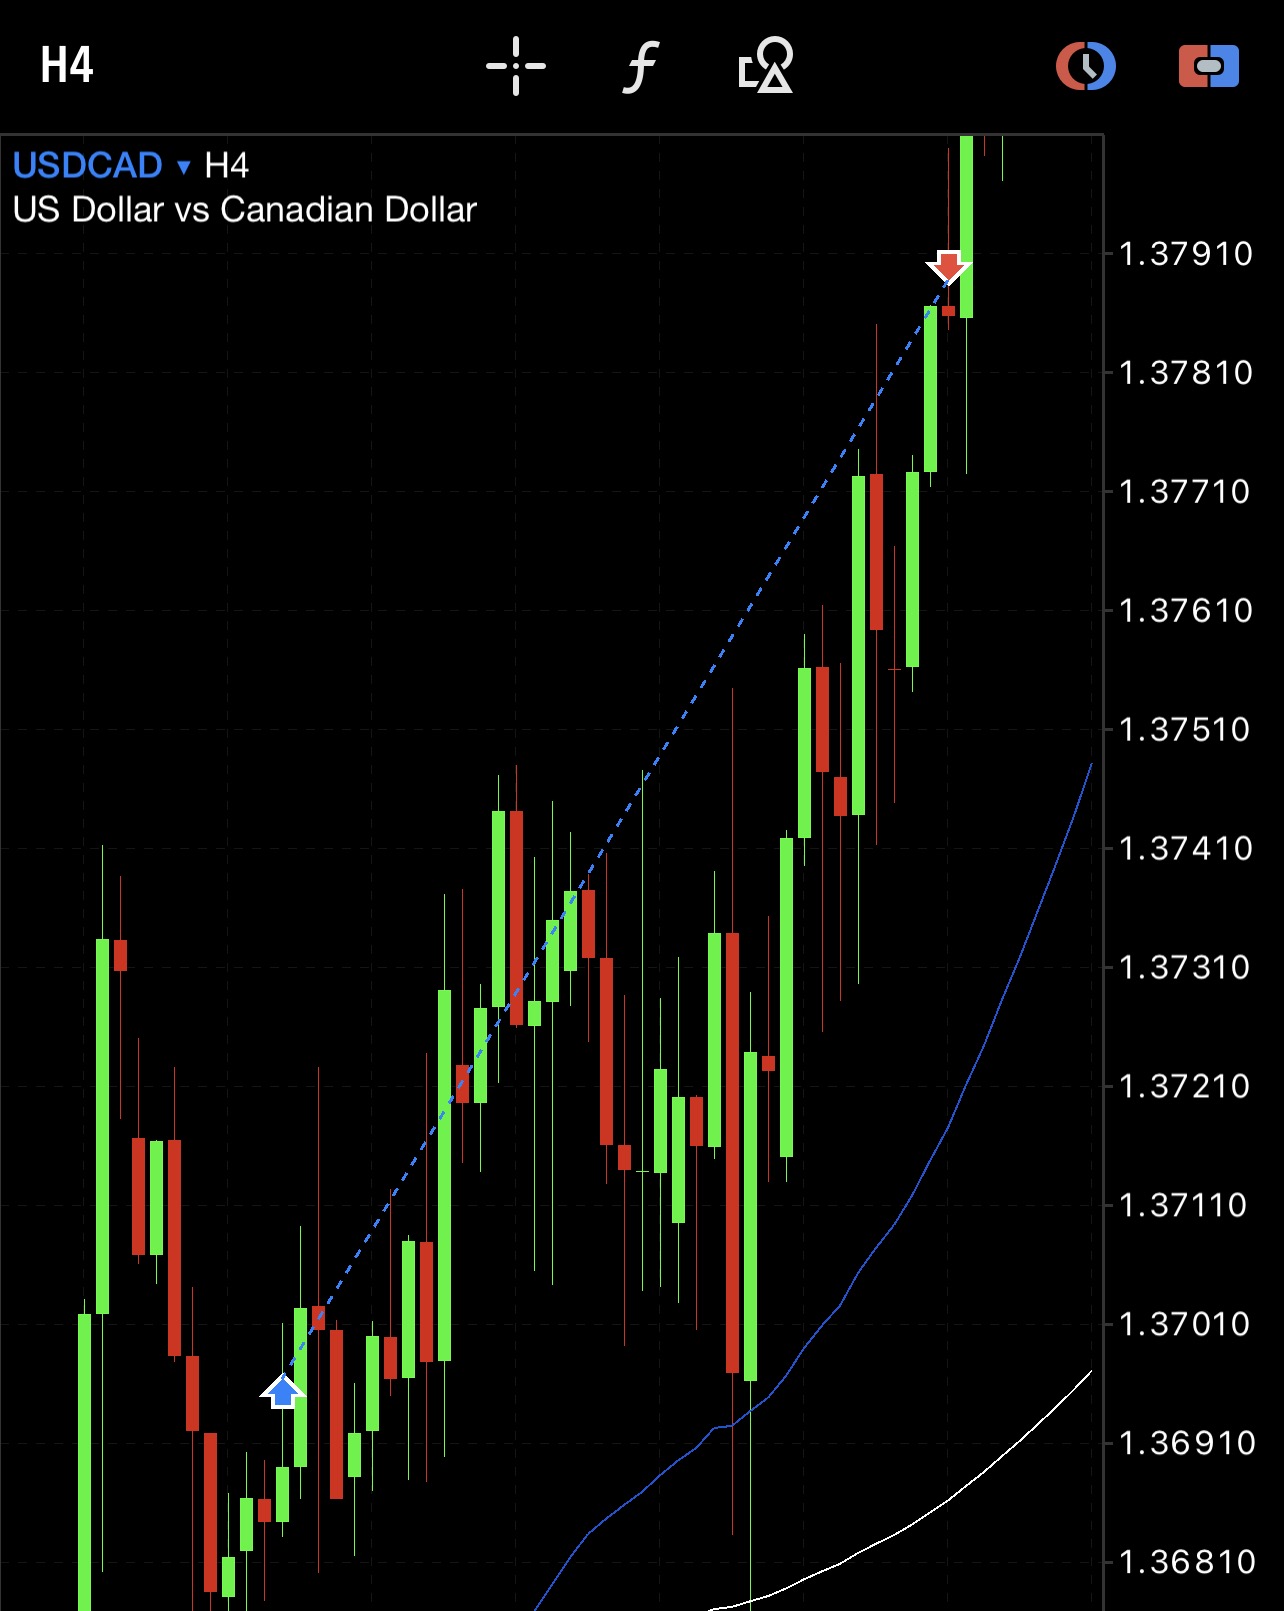
USDCAD winning trade, +$4.8K at 2.37R
NTLA winning trade, +GBP1.2K at 3.45R
GBPUSD broker profit
GBPUSD entry and exit
USDCAD entry and exit
USDCAD entry and exit, zoomed

Illustrative results from real RB Trading trades and members. Past performance is not indicative of future results. All content is educational only and not financial advice — you are always responsible for your own risk.

Three steps.
Zero noise.

01
Get the playbook
Every Sunday night your dashboard refreshes — EMA setups, forex levels and squeeze plays with exact entries, stops and targets. Ready before markets open.
02
Set and forget
Pre-set limit orders and stop-losses before the week opens. The market works while you live your life — no screen-watching, no second-guessing.
03
Live trigger watch
The moment a setup fires, the Live Trigger Watch updates in real time. Break-above vs close-above tracked precisely — no wick fakes, no late alerts.
Live trigger watch
The moment a level tags it flips to IN TRADE here, and the alert lands in your inbox.
The change

Stop guessing.
Trade with a plan.

Same you. Same account. A completely different week.

Trading now
Sunday night, still no idea what you're trading Monday
Chasing tips, screenshots and random signals
Clicking buy with no stop, just hoping
One bad day and the prop challenge is gone
Glued to charts all day, still catching FOMO
Trading with RB
Your week mapped before the open: exact entries, stops, targets
Every trade clears the 3-Gate System (Trend · Momentum · Risk)
You know your risk before you click buy
Breach-aware discipline that keeps funded accounts alive
Walk away. The Live Trigger Watch pings you when it's time

One source.
Not six.

Everyone else
"Watch this level" — no exact entry
Signals posted after the move
No stop-loss, no target — "you figure it out"
AI-generated with no accountability
Stocks or forex — never both
No track record, no receipts
RB Trading
Exact entry price on every setup
Ready before markets open Monday
Hard SL and TP mapped on every trade
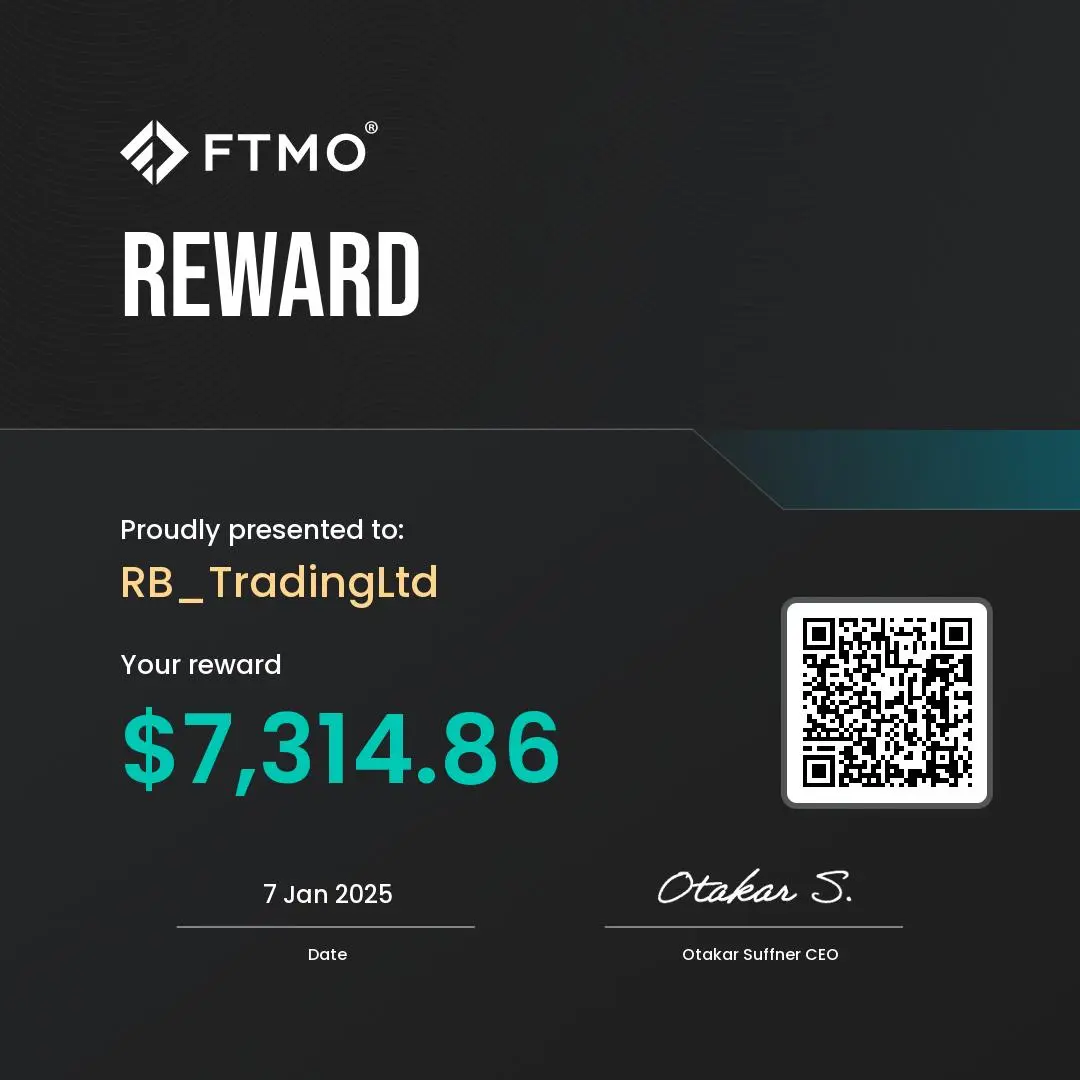
A funded trader — with verified payouts
Stocks + Forex + Short Squeeze
Real months shown — losing weeks included
Member testimonial
★★★★★
"Beats ICT all day everyday. Simple easy to understand strategy."
— verified subscriber
Member testimonial
★★★★★
"Made enough in my first week to pay for the month's costs so all good so far."
— James K., 2 days after joining
★★★★★
"Stress free as I work full time. Set entries and go about your day knowing they will get you in."
— verified subscriber
★★★★★
"Pays for itself easily within a few weeks. Good risk management tips."
— verified subscriber
★★★★★
"First profitable month in 8 months. The EMA setups are clean and I actually understand what I'm trading now."
— T. Barnes, 6 weeks in
★★★★★
"Finally a newsletter that tells you WHERE to enter, not just 'watch this level'."
— verified subscriber
★★★★★
"Stopped revenge trading. Having the plan set on Monday changed everything."
— D. Walsh, prop trader
Member testimonial
★★★★★
"I used to spend Sunday nights stressed. Now I just open RB Trading and I'm done in 10 minutes."
— verified subscriber
★★★★★
"The short squeeze section alone is worth the price. Caught two big runners in May."
— verified subscriber
★★★★★
"Cancelled my ICT subscription. This is the only trading resource I need now."
— C. Morley, full-time trader
Member testimonial
★★★★★
"Beats ICT all day everyday. Simple easy to understand strategy."
— verified subscriber
Member testimonial
★★★★★
"Made enough in my first week to pay for the month's costs so all good so far."
— James K., 2 days after joining
★★★★★
"Stress free as I work full time. Set entries and go about your day knowing they will get you in."
— verified subscriber
★★★★★
"Pays for itself easily within a few weeks. Good risk management tips."
— verified subscriber
★★★★★
"First profitable month in 8 months. The EMA setups are clean and I actually understand what I'm trading now."
— T. Barnes, 6 weeks in
★★★★★
"Finally a newsletter that tells you WHERE to enter, not just 'watch this level'."
— verified subscriber
★★★★★
"Stopped revenge trading. Having the plan set on Monday changed everything."
— D. Walsh, prop trader
Member testimonial
★★★★★
"I used to spend Sunday nights stressed. Now I just open RB Trading and I'm done in 10 minutes."
— verified subscriber
★★★★★
"The short squeeze section alone is worth the price. Caught two big runners in May."
— verified subscriber
★★★★★
"Cancelled my ICT subscription. This is the only trading resource I need now."
— C. Morley, full-time trader
Simple pricing

Stop guessing.
Start trading with a plan.

Launch offer · 20% off annual
RB Trading Premium
The 20% launch discount applies to the annual plan — $199 instead of $348 paid monthly · cancel anytime
Inside the TradeThe full premium newsletter — every breakdown, every call
+
The Trade DeskThe live dashboard — setups, triggers, alerts, buy zones
  • The Trade Desk — weekly setups across 100+ markets with exact entries, stops and targets
  • Live Trigger Watch + email alerts when trades fire
  • Inside the Trade — 2 letters every week (100+ a year)
  • TradingView indicator suite — 4 invite-only algos
  • Masterclass library — 20+ lessons, beginner to funded
  • Member perks — the Pro Journal at your member rate + prop-firm deals
  • Cancel anytime — no questions asked
Get instant access →
Less than one bad trade. Instant access to everything above.
Lifetime membership — $399/year For traders who want to back the desk. Everything above, plus your rate locked forever — you never pay more no matter how far the list price rises — and your own chart and asset breakdown requests answered directly.
Become a lifetime member →

Got questions?
Here are the answers.

What is the Trade Desk?
The Trade Desk is RB Trading's live weekly trading dashboard. Every Sunday before the open, the week's analysed setups go live across large-cap stocks, forex majors and crypto — each with the exact entry, stop-loss and scale-out targets — plus a real-time trigger watch, a 20+ stock short-squeeze watchlist and a 200-week buy-zone scanner covering 890+ assets. One subscription also includes the Inside the Trade newsletter (2 letters a week), the TradingView indicator suite and the masterclass library. Educational analysis only — not financial advice.
What is The 3-Gate System?
It's the RB Trading blueprint every setup on the dashboard follows. A trade only makes the list if it clears three gates: Trend (higher-timeframe EMA structure confirmed), Momentum (the DeMarker signal agrees), and Risk (a hard stop and scale-out targets set before entry). Miss one gate and the setup is cut — so you only ever see high-conviction trades across long-term investing, day trades, swing setups, short squeezes and EMA + DeMarker forex.
Who is this for?
Any trader who wants a structured plan before the week opens — whether you trade stocks, forex, or crypto, full-time or around a day job. The setups come with exact entries, stops and targets so you don't need to stare at charts all day.
Do I need trading experience?
No. Every setup includes the entry price, stop-loss and take-profit levels. If you understand basic order types you can follow along. The Example Trades section also shows annotated charts of exactly what each setup looks like.
When is the dashboard updated?
Every Sunday before markets open. You log in Monday morning and the full week's plan is already there — EMA Swing Setups, Forex Levels, Short Squeeze watchlist and Portfolio Buy Zones. The Live Trigger Watch updates in real time throughout the week.
What markets do you cover?
100+ markets across stocks (large-cap US), forex (major and minor pairs), crypto (BTC, ETH and more) and a long-term 200-week buy zone tracker covering 890+ assets across the S&P 500, Dow Jones, FTSE 100, DAX and Nikkei 225, plus indices, sectors, bonds, commodities and crypto.
Is there a free trial?
No trial — one setup that works pays for the year. At $29/month that's about 95¢ a day. The annual plan is better value again: the 20% launch discount takes it to $199 for the year, which is 55¢ a day and $149 less than paying monthly. Instead of a trial you get a full published track record — 86 closed trades, losers included — and a free sample letter, so you can judge the work before paying. Cancel anytime through Substack with one click.
What exactly do I get for $29 a month?
Everything, one subscription: the live Trade Desk dashboard (weekly setups, live triggers, alerts, squeeze watchlist, 200W portfolio builder), Inside the Trade — two educational letters every week covering the reasoning behind the trades, psychology and building lasting income — the TradingView indicator suite (4 invite-only algos), the growing masterclass library, and member perks including the Pro Journal at a member rate and prop-firm discounts.
How do I access the dashboard after subscribing?
Subscribe on Substack, then return here and enter your Substack email address. The dashboard unlocks instantly — no app download, no separate login. Works on any device.
Is this financial advice?
No. RB Trading is educational content for members. All setups are shared for learning purposes only. You are always responsible for your own risk management and trading decisions.
This week's plan is ready

Your next trading week
is already mapped.

Exact entries, stops and targets across 100+ markets — plus the full Inside the Trade newsletter. One subscription, everything unlocked.

Get this week's setups From 55¢ a day — $199/yr with 20% off launch · cancel anytime
Guides: The published record · Trade Desk vs signal groups · How to choose a trading service
Instant access · Newsletter + Trade Desk included · ✕ Not AI — a funded trader
Get the weekly plan →
RB TradingWeekly Trade Dashboard
Updated 25 May 2026
Swing SetupsStocks & crypto
ForexForex setups
Vol Entries1H entries
SqueezeSqueeze stocks
ExamplesExample trades
BuilderLong-term
AlertsYour alerts
New here? How this dashboard works
1
Read the planThe “This Week” bullets up top are the week’s summary — what we’re watching and why.
2
Watch the triggersThe Live Trigger Watch updates in real time and flags the moment a setup goes live. The badge guide below explains every state.
3
Open a sectionTap a tab for the full setups — exact entries, stops and take-profit targets.
Swing Setups Daily-chart swing trades on large-cap stocks & crypto.
Forex EMA + DeMarker trend levels on the major pairs.
Vol Entries Mid-week 1H setups called off the Vol Entries indicator — posted with the chart as they are taken, with a before-and-after once they close. Written calls, not board setups, so manage the trade yourself.
Squeeze High short-interest stocks with active setups.
Examples Annotated charts of exactly what each setup looks like.
Builder Long-term 200-week EMA buy zones — accumulate quality slowly, no leverage.
What the live badges mean
WatchingNot there yet — price hasn’t reached the trigger. Nothing to do but wait.
In tradeLive now — the entry is in, and the setup’s stop and targets apply. “Triggered” means the same thing the moment it fires.
Wait for pullbackIt ran too far past the trigger to enter here — buying now would leave under 1.5R to target. Wait for a pullback to the marked price. Not a trade yet; the stop and target don’t change, only your entry improves.
ManagingBeing held through earnings, or it gapped clean through the stop. The auto-stop is paused and the trade is managed by hand — no win or loss is booked until it’s closed.
Target hitThe trade reached its target. A win.
StoppedThe trade hit its stop. A loss.
Some setups — the forex daily-close levels and certain stocks — trigger on the daily close above the level, not an intraday tap. Those go live at the next session’s open: a level that closes above on Monday flips to In trade when the market opens Tuesday, at that opening price.
Every setup clears The 3-Gate System — Trend, Momentum, Risk. Tap any of thousands of tickers — US stocks, ETFs, forex and crypto — to open its chart, fundamentals, seasonality and volatility. Educational only — always manage your own risk.
DeM 14Oversold <0.30Leaning Buy 0.30-0.44Mid 0.45-0.55Leaning Sell 0.55-0.70Extended >0.70
AssetEMA TrendDeM 14Signal & Trade Idea
No matches for that search.
Currency Strength Live · powered by TradingView
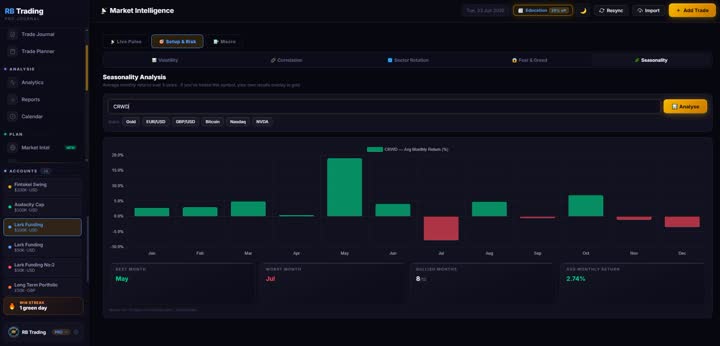
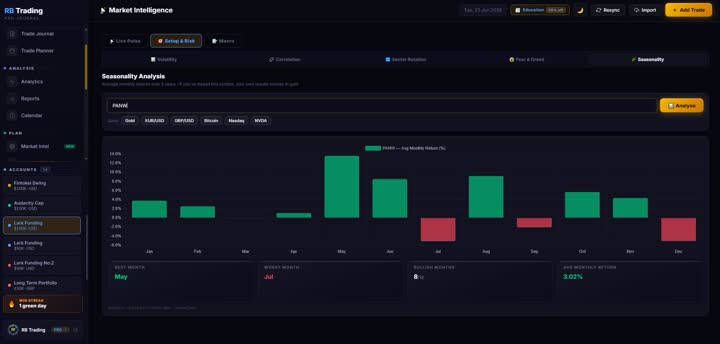
Forex Seasonality
Which months favour your pair?
Average monthly return over ~5 years — type any pair or pick one below.
EUR/USD GBP/USD USD/JPY AUD/USD USD/CAD Gold
DeM 14Oversold <0.30Leaning Buy 0.30-0.44Mid 0.45-0.55Leaning Sell 0.55-0.70Extended >0.70
PairEMA TrendDeM 14Signal & Trade Idea
No matches for that search.

Vol Entries

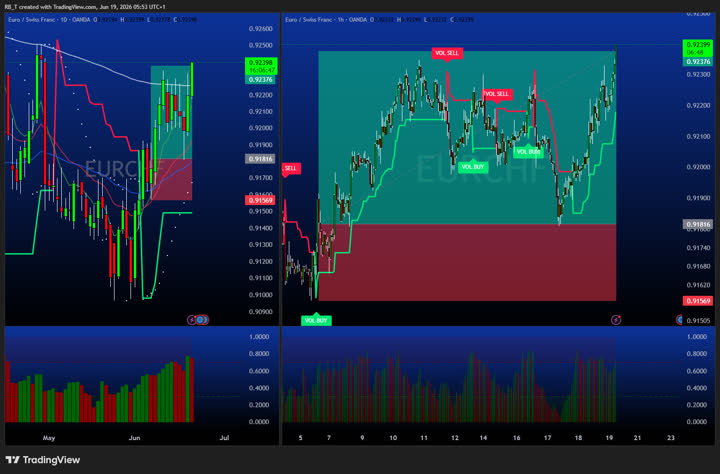
Entries taken off the Vol Entries indicator on the 1H, spotted after Sunday’s board went out. Posted here exactly as they go into the Substack chat, with the chart. These are written calls, not board setups — no live trigger state and no alerts on them, so read the note and manage the trade yourself.

Off — you only see updates when you open this tab.

What a Vol Entry is

Vol Entries come off my own 1H indicator, built for intraday moves inside the London and New York sessions. It reads three things at once and only marks a setup when all three line up.

Volume spike Real money arriving, not drift. The move has to be carried by a genuine jump in participation rather than a quiet grind.
Adaptive volatility bands The bands widen and tighten with the pair’s own range, so a level means the same thing on a quiet morning as it does in a fast one.
Directional momentum filter Which way the session is actually leaning. It keeps me out of the spikes that fire against the prevailing push.

Where those three agree, the setup arrives with its stop and target zones already defined — which is why every call below carries a stop and a target in the note, not just a direction.
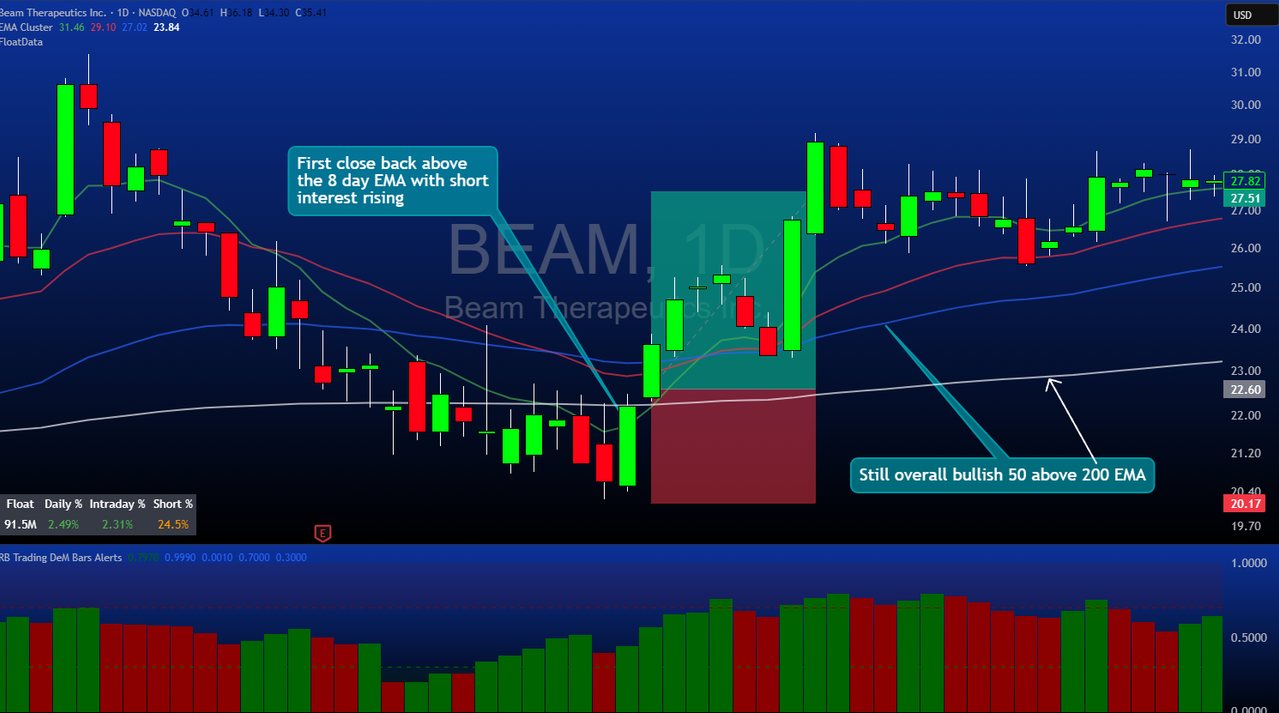
These land whenever they land. There is no schedule to them. A Vol Entry can show up in any session, on any day, and I post it here the moment I take it — the same words and the same chart that go into the Substack chat. That is also why there are no alerts on this tab: check it when you are at your screen, and treat anything here as a trade to manage yourself.
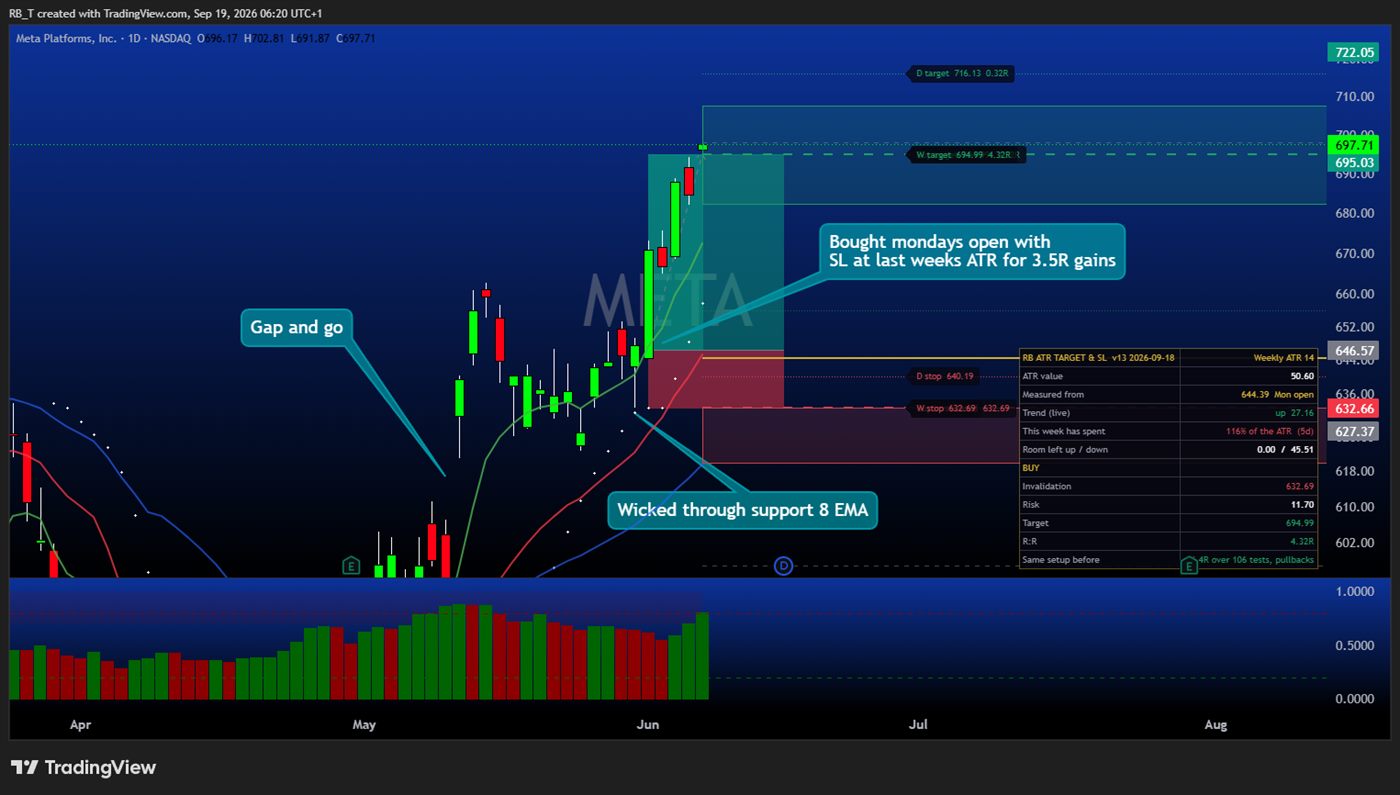
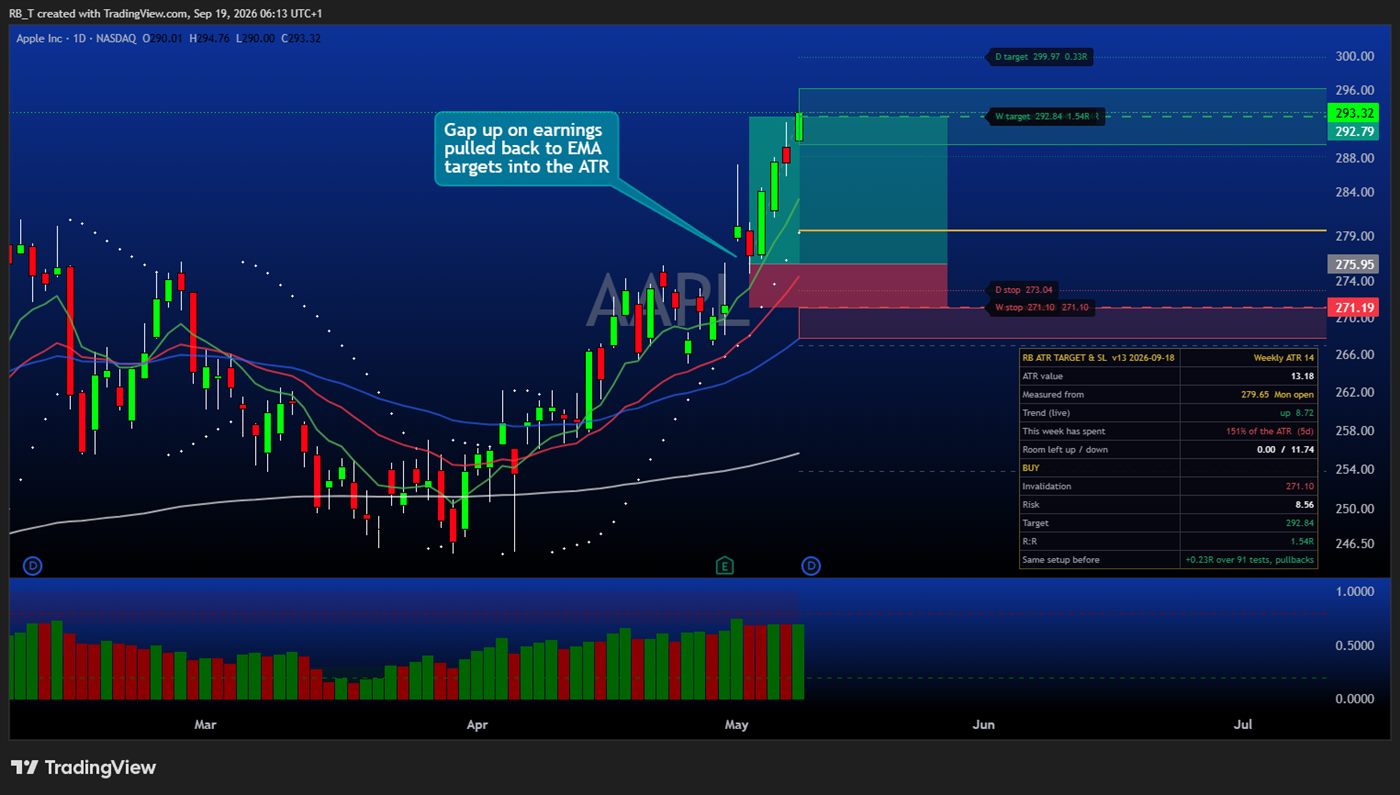
Example trade setup Example trade setup

Position Sizing

Risk only 1% of your account per position. $10,000 account = max $100 risk per trade.

Stop Loss

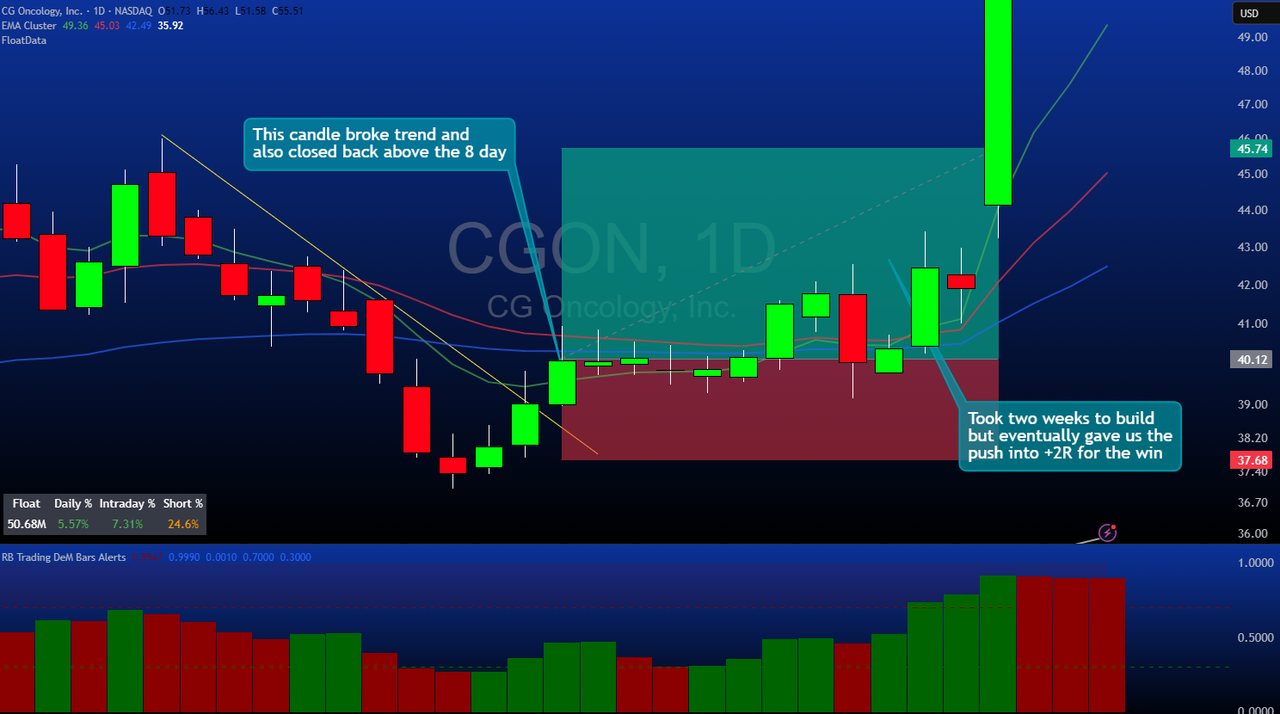
Stops go under the low of the breakout candle. Clear invalidation — if it breaks back below, the setup failed.

Entry Strategy

Entries are called in the chatroom. Check regularly. Never chase breakouts — wait for confirmation.

Take Profits

Scale out at targets. Take partial profits at 2R, let the rest run with a trailing stop.

Market Cap >$2B Volume >1M Price >$10 Short Interest >20%
#TickerPriceChangeVolumeMkt CapTrade Idea
No matches for that search.
Winning setups — what to look for
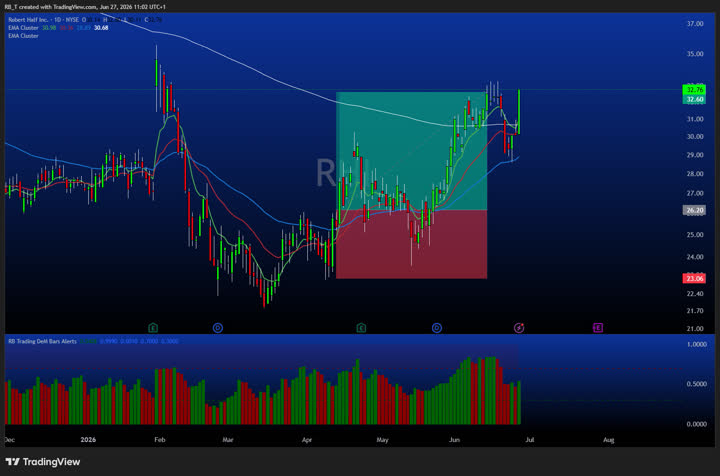
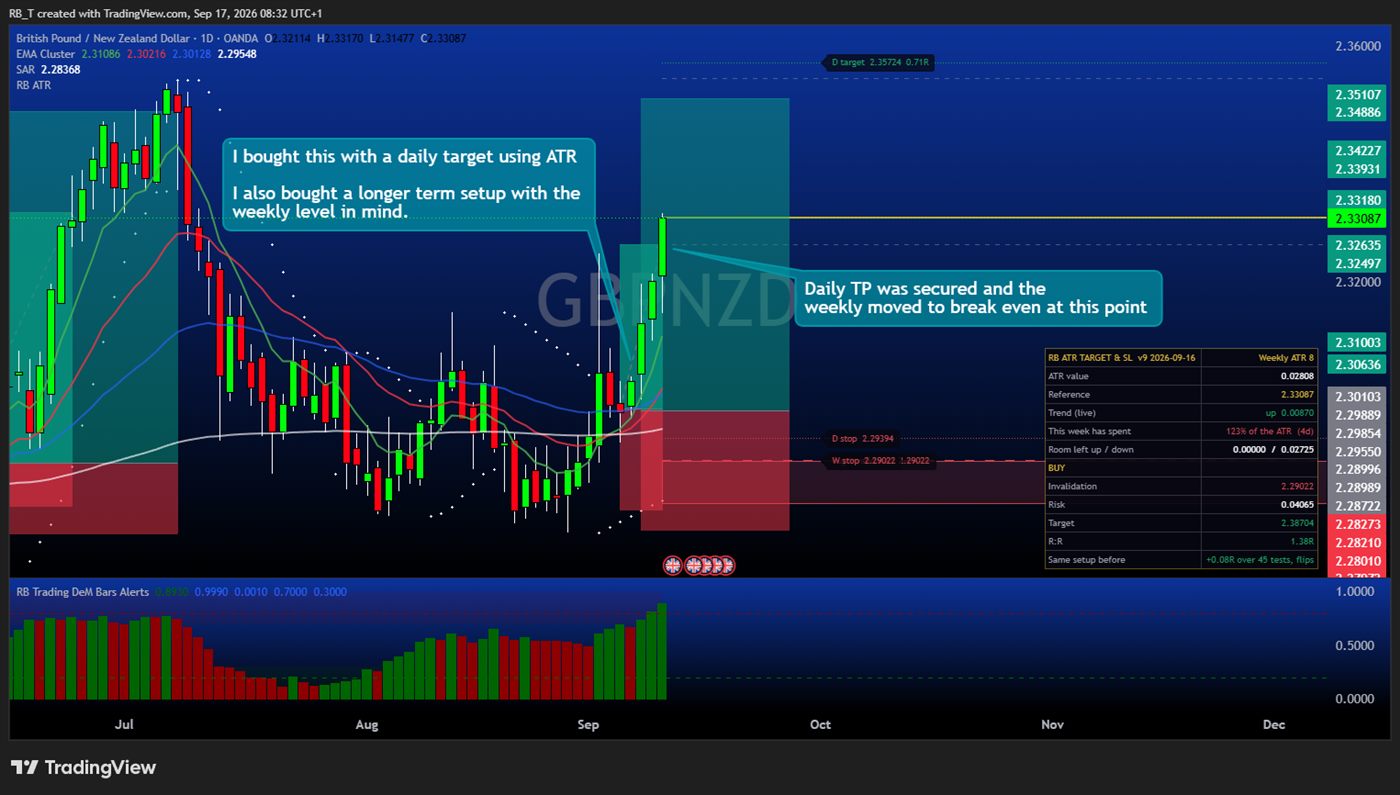
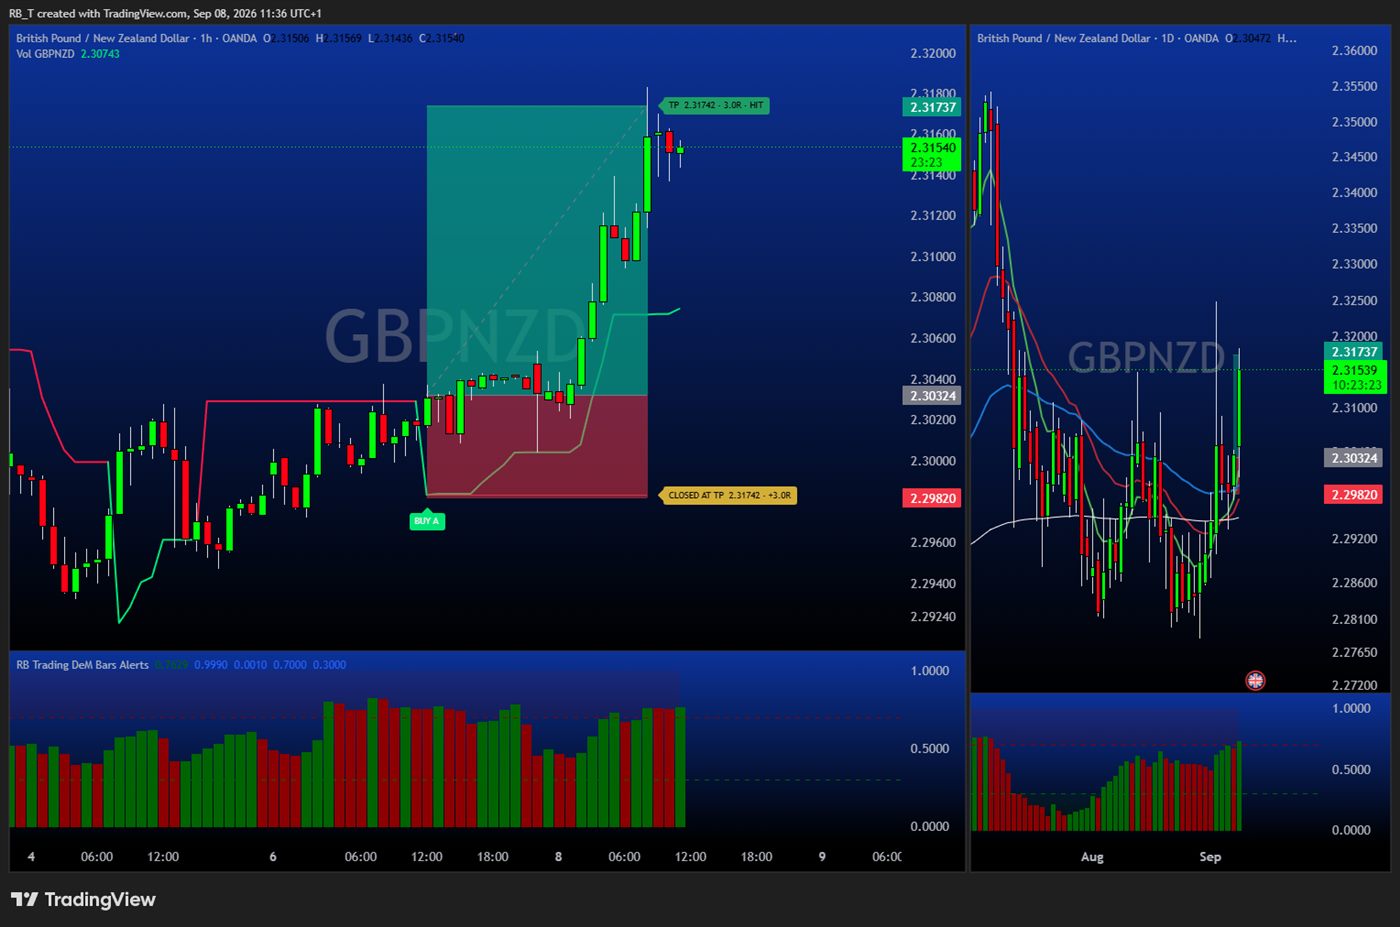
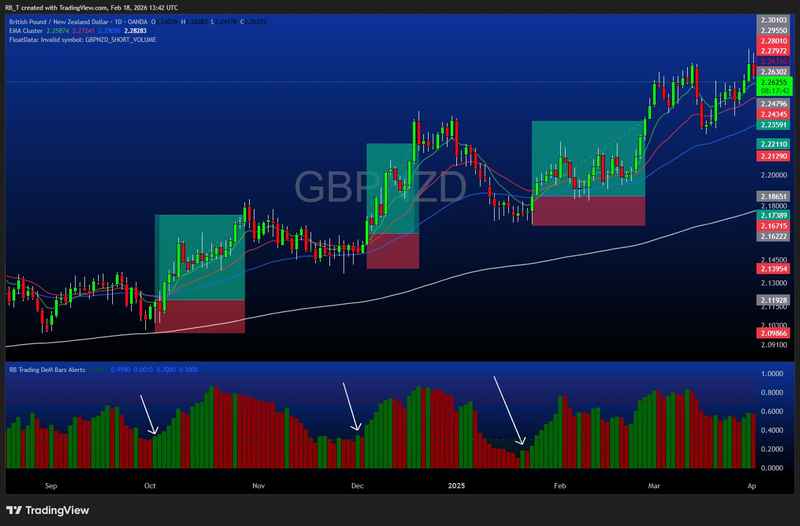
GBP/NZD example trade
GBP/NZD
8/21 EMA BullishDeM < 0.3Daily CloseLong Setup
Price pulls back into the 8-21 EMA zone while the DeM dips below 0.3. We wait for a strong bullish candle close to confirm the entry, with stops below the trigger candle.
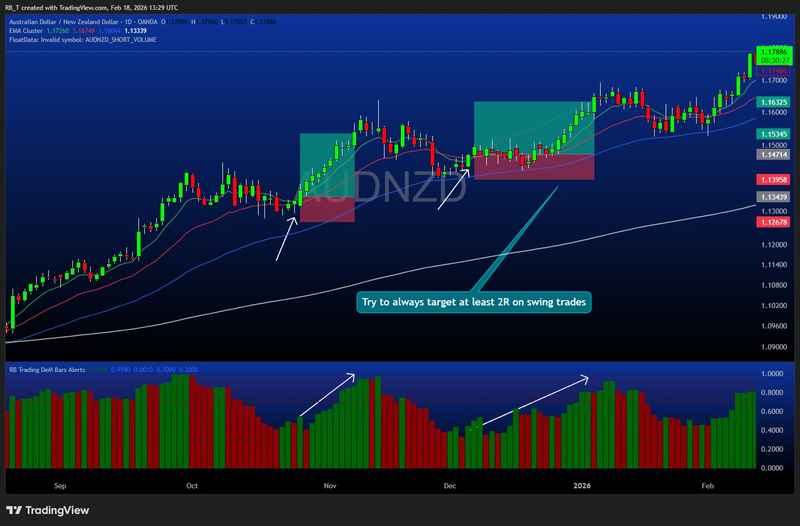
AUD/NZD clean trend example
AUD/NZD · Clean Trend
50/200 EMA BullishEMA PullbackDaily Close2R+ Target
Long-term trend confirmed bullish with the 50 above the 200 EMA. Price retraces into the 8-21 zone, the DeM cools from extended readings, and we target a minimum 2R from entry.
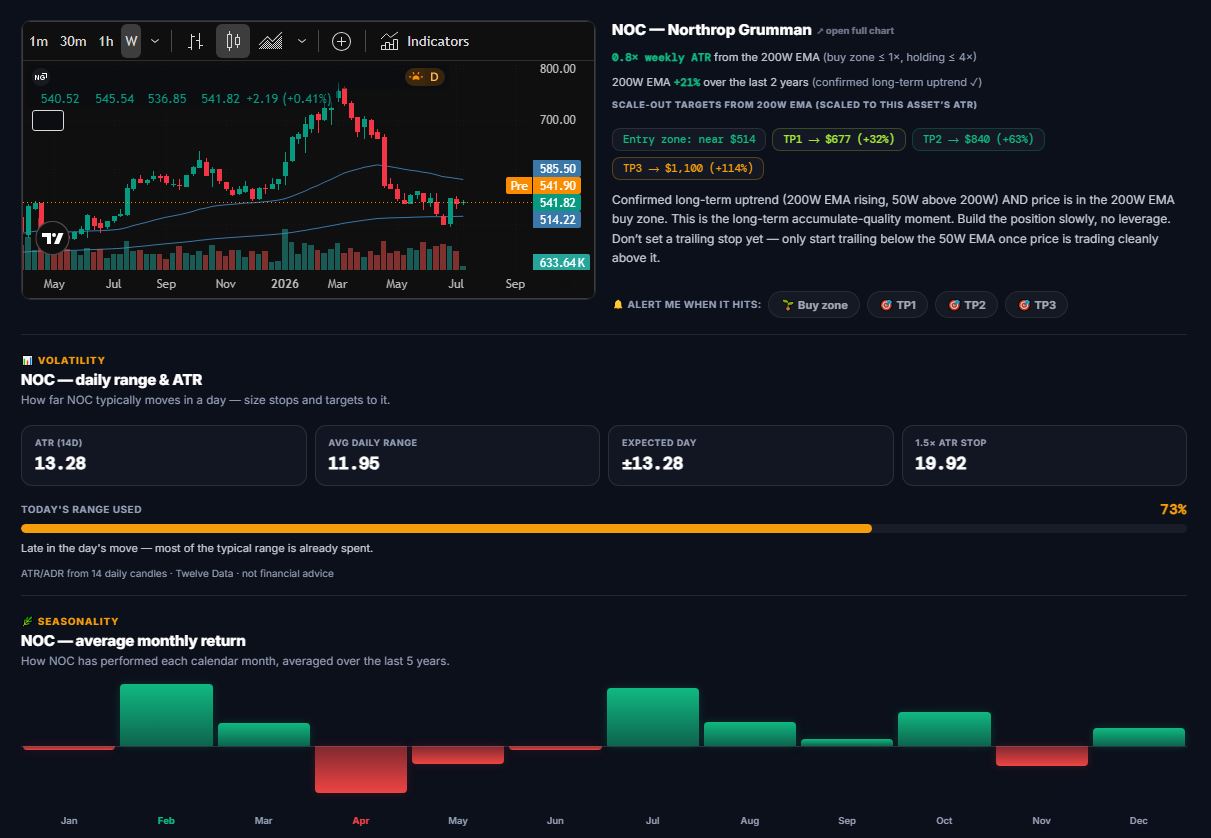
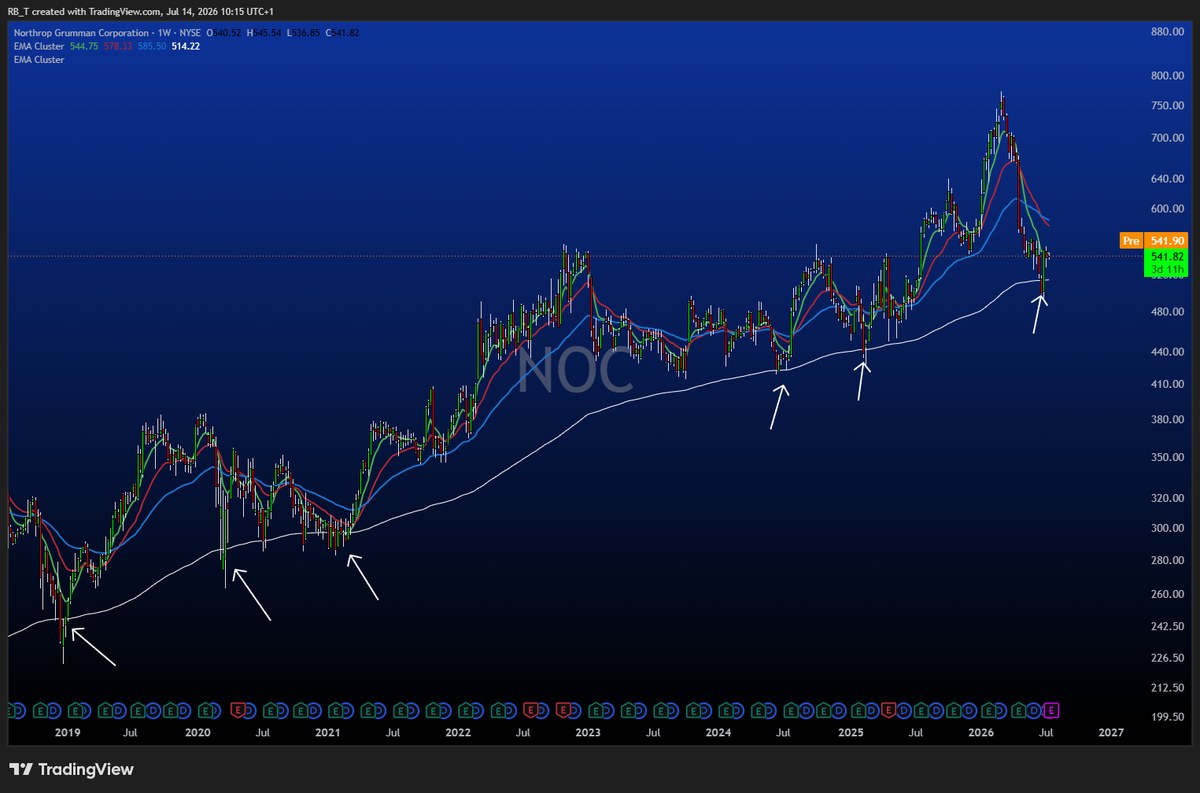
Northrop Grumman 200-week EMA buy zone example
NOC · Northrop Grumman
200W EMABuy ZoneWeeklyLong-term
Price tags its rising 200-week EMA (white line) and bounces — the same long-term accumulate signal repeating across years. We build the position slowly in the zone, no leverage, and let the weekly trend carry it.
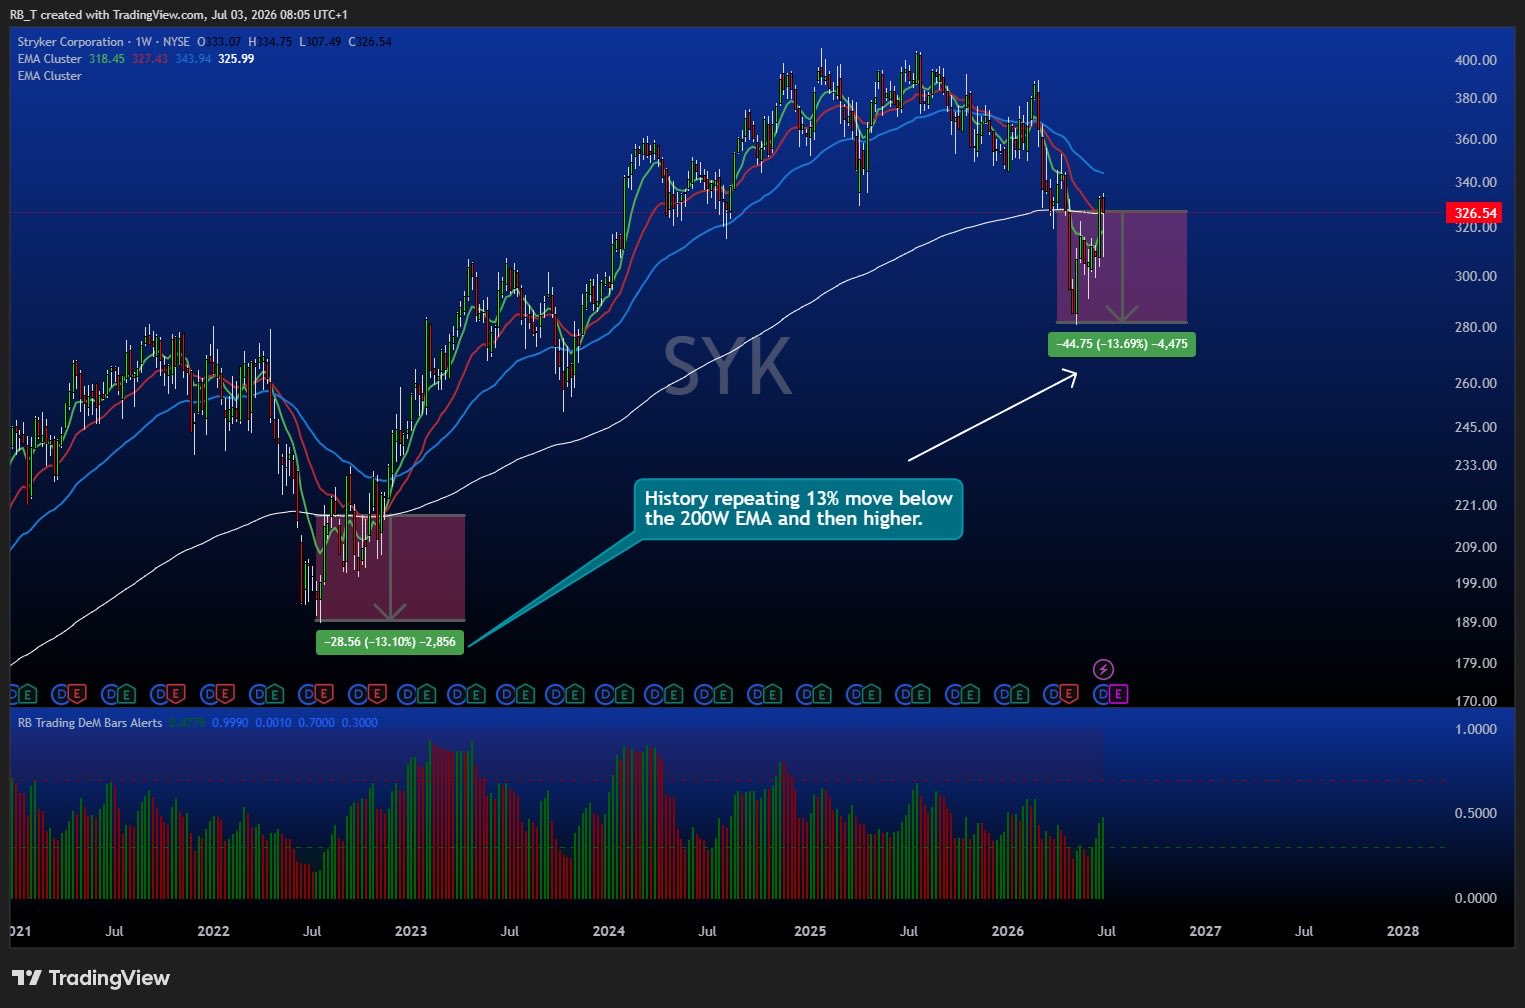
Stryker 200-week EMA dip-and-recover example
SYK · Stryker
200W EMADeM BarsWeeklyHistory Repeats
History repeating: a ~13% dip below the 200-week EMA, then back to higher highs — the same shape that played out two years earlier. The DeMarker bars cool into the dip, confirming exhaustion before the turn.
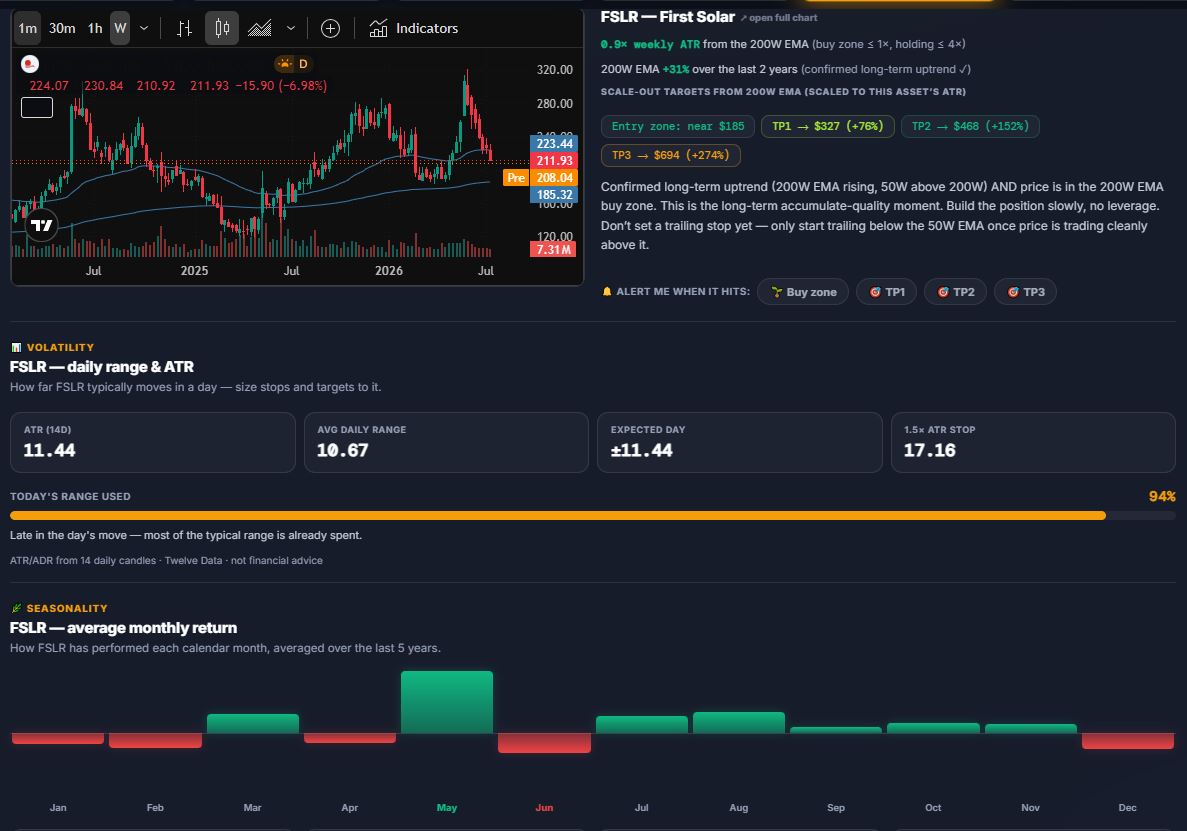
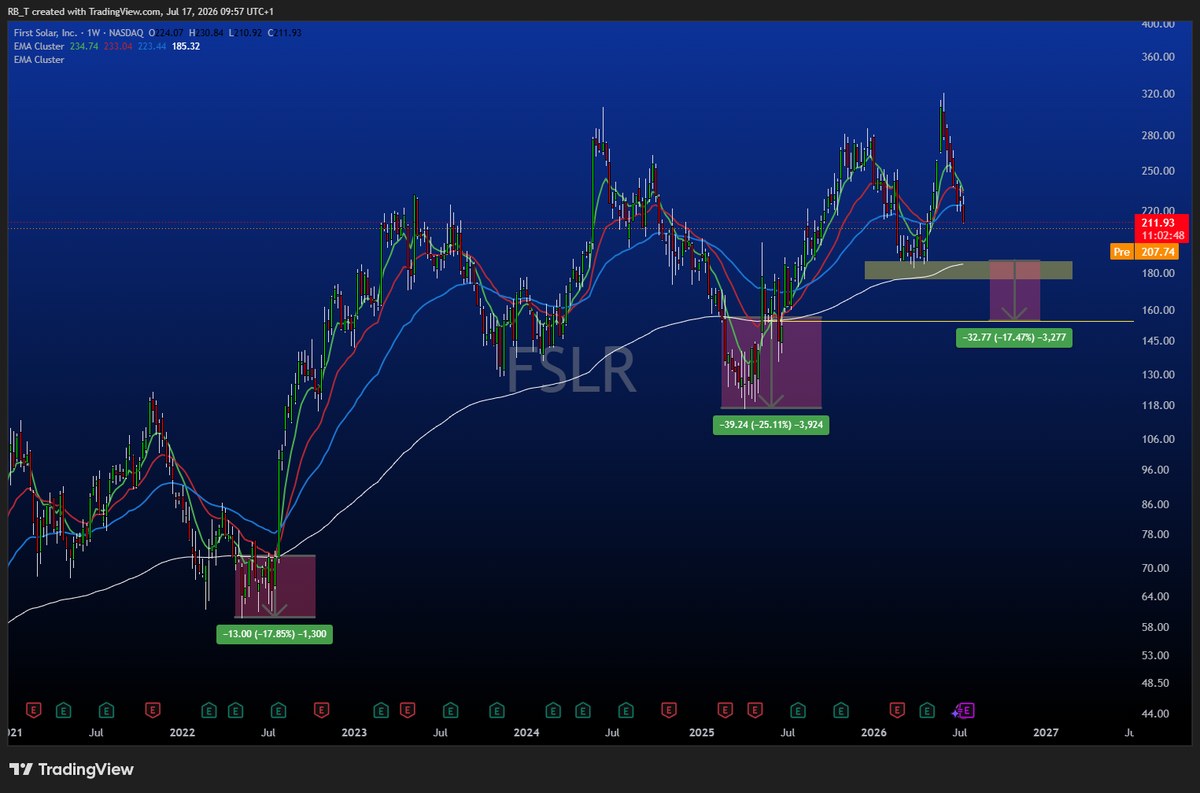
First Solar measured dips into the 200-week EMA example
FSLR · First Solar
200W EMABuy ZoneWeeklyMeasured Dips
Even in a strong uptrend, First Solar dips 17–25% into its 200-week EMA before resuming. We size for that: accumulate in the zone, keep the stop below the deeper level, and never chase the strength.
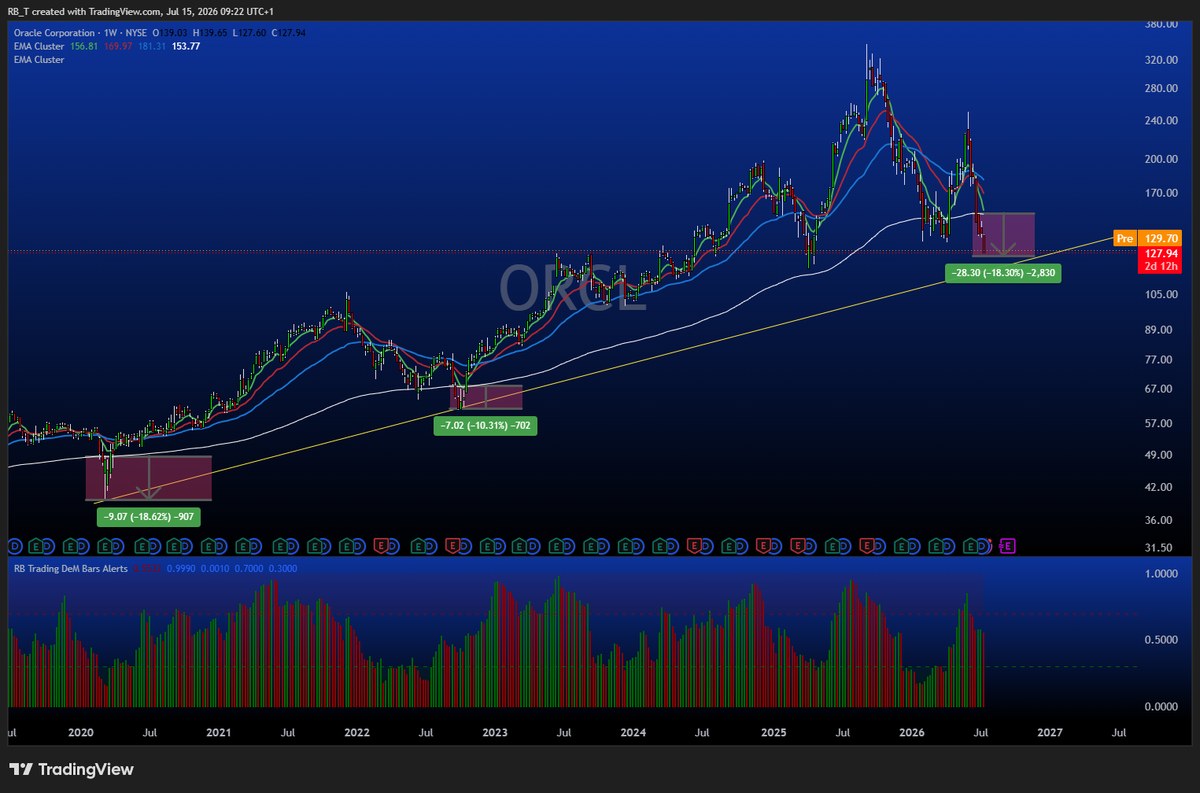
Oracle 200-week EMA dip and DeMarker example
ORCL · Oracle
200W EMADeM BarsWeeklyRepeatable Dip
Two dips into the 200-week EMA, roughly 10% and 18% deep, each a long-term buy zone that resolved higher. The DeMarker bars flush red into the low and turn — the momentum tell we wait for before adding.
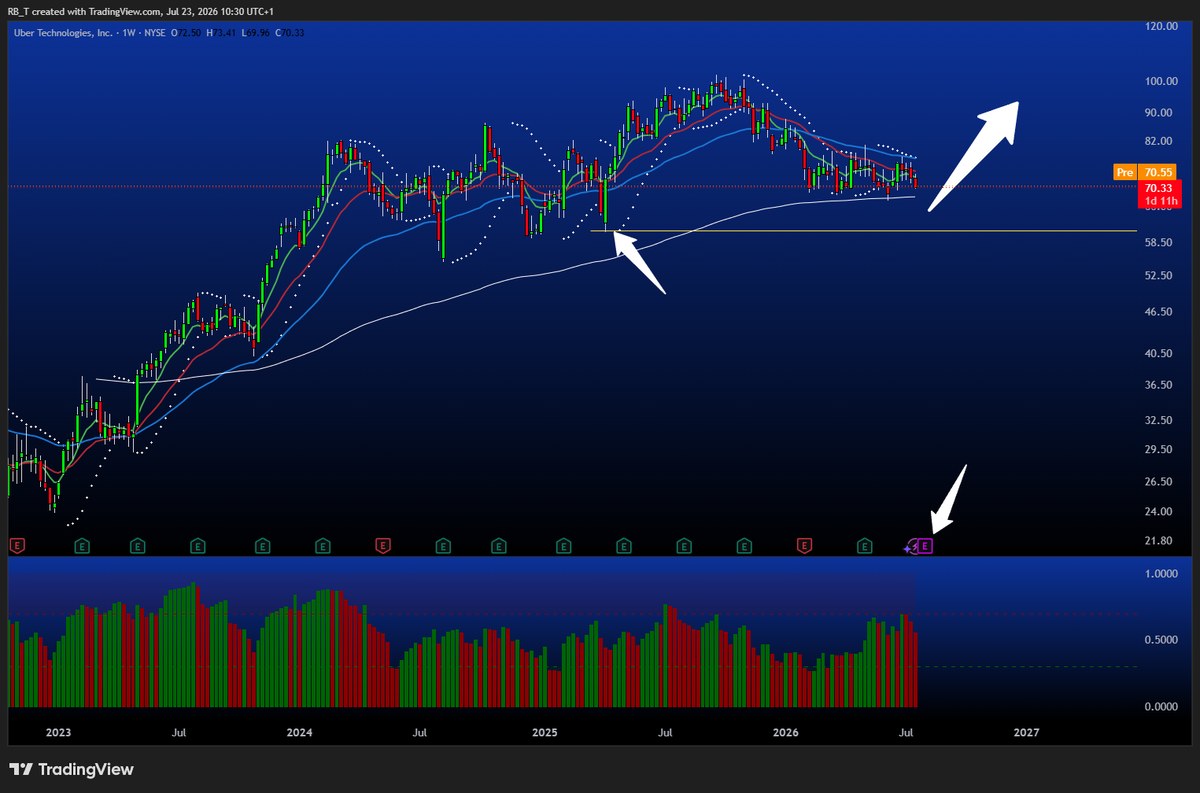
Uber 200-week EMA bounce with earnings marker example
UBER · Uber
200W EMAEarnings RiskWeeklyBounce
Price rides back to the rising 200-week EMA for the bounce — with the earnings marker flagged on the timeline. Long-term buy zone, but manage the stop manually around the print: gaps don't respect resting stops.
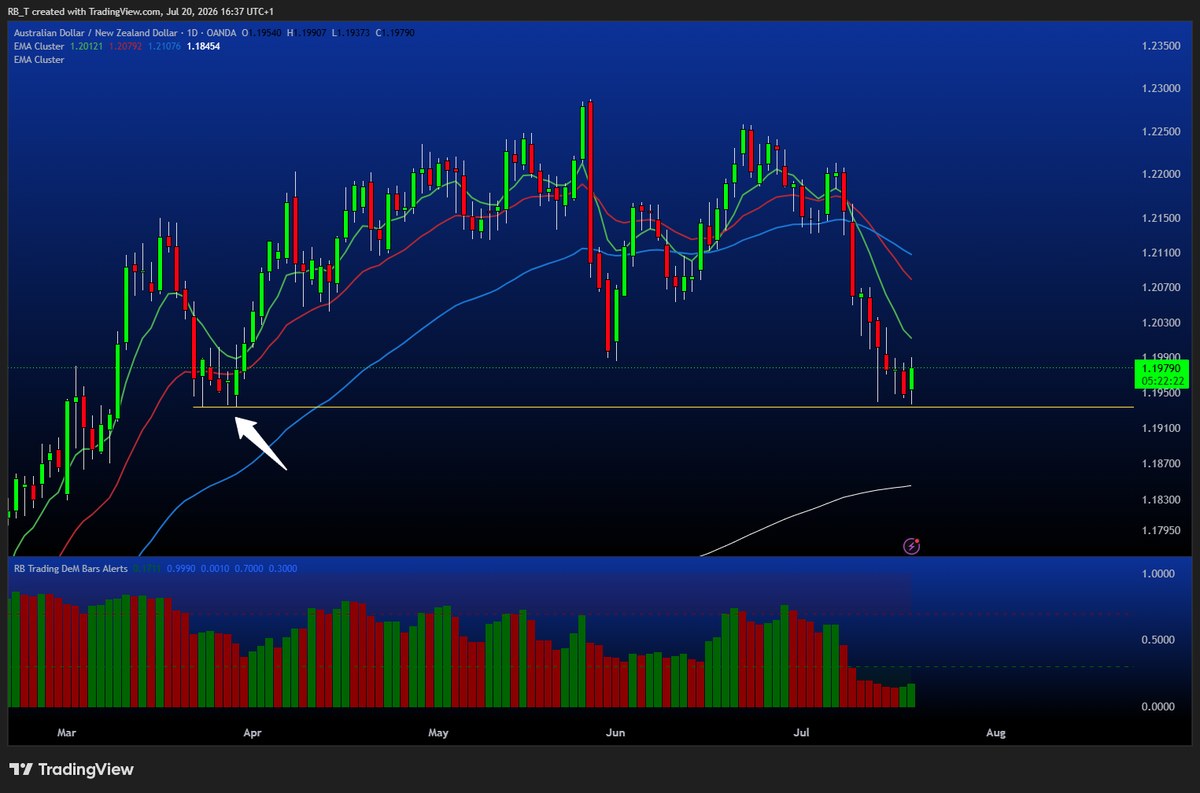
AUD/NZD EMA cluster and DeMarker forex example
AUD/NZD
8/21 EMADeM BarsDailySupport Retest
Daily forex: price pulls back through the EMA cluster to a tested support shelf while the DeMarker bars cool from overbought. We watch that shelf for a reaction rather than selling into the hole.
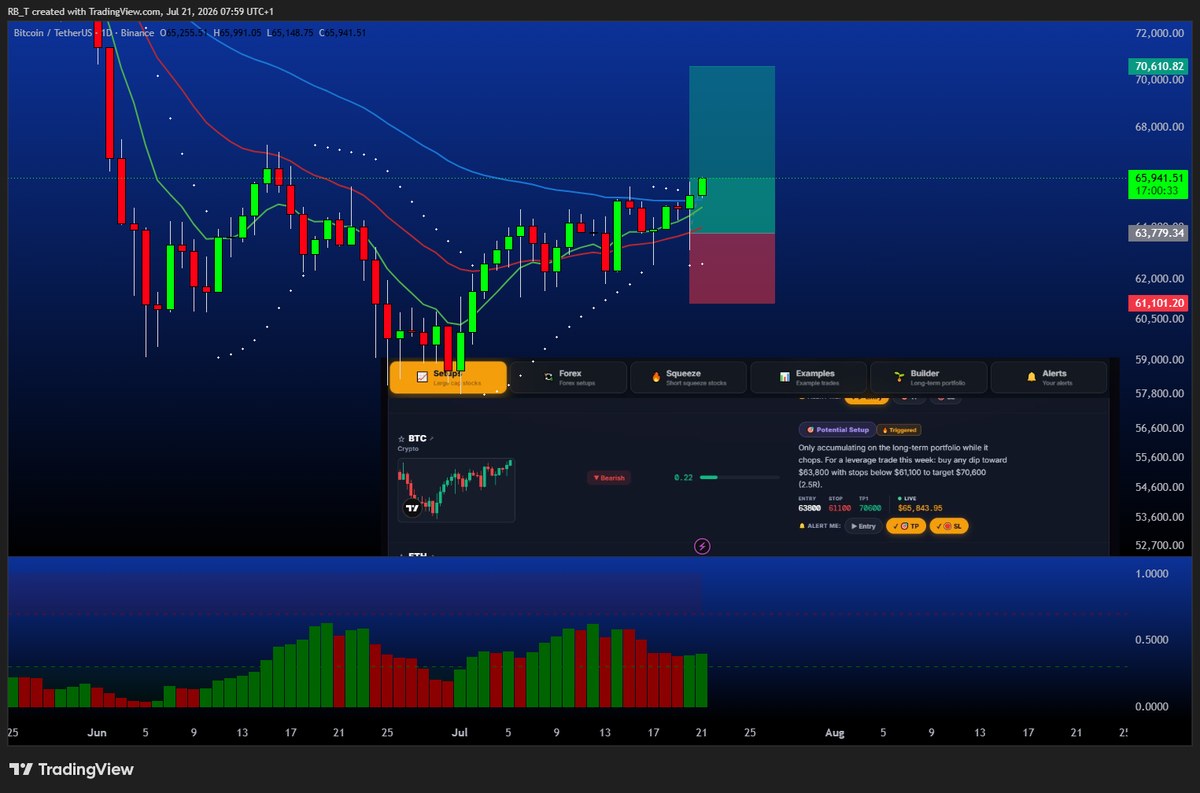
Bitcoin setup with mapped risk-reward example
BTC · Bitcoin
CryptoRisk:RewardDailyMapped Levels
The exact setup as it appears on the desk: entry, stop and target mapped before the week opens, with the risk:reward box drawn on the chart. Accumulate the long-term core on dips; take the leverage trade only on the defined level.
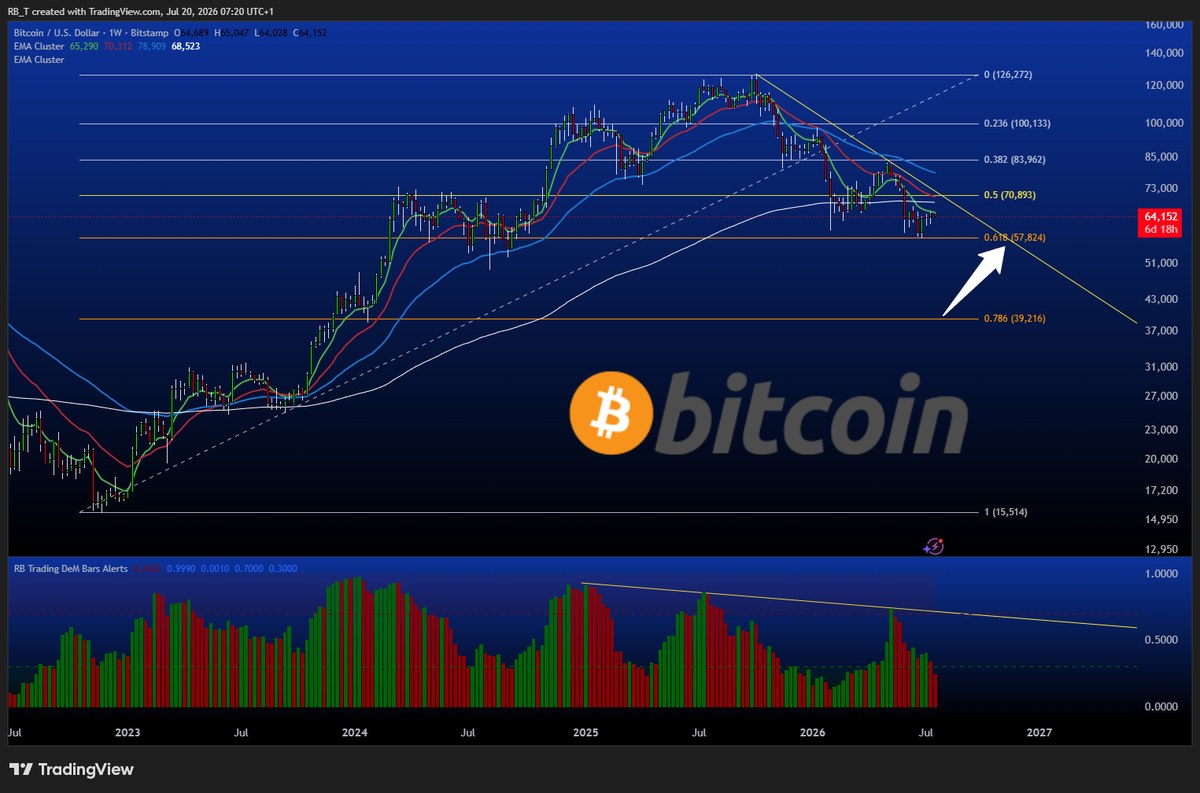
Bitcoin weekly Fibonacci and EMA example
BTC · Bitcoin (Weekly)
Fibonacci200W EMADeM BarsWeekly
The bigger-picture map: weekly Fibonacci levels off the last major swing, layered with the EMA cluster and DeMarker bars. The 0.618 retracement lines up with the rising 200-week EMA — where we start scaling the long-term core.
Portfolio Builder — 200 Week EMA Buy Zones Long-term · No leverage
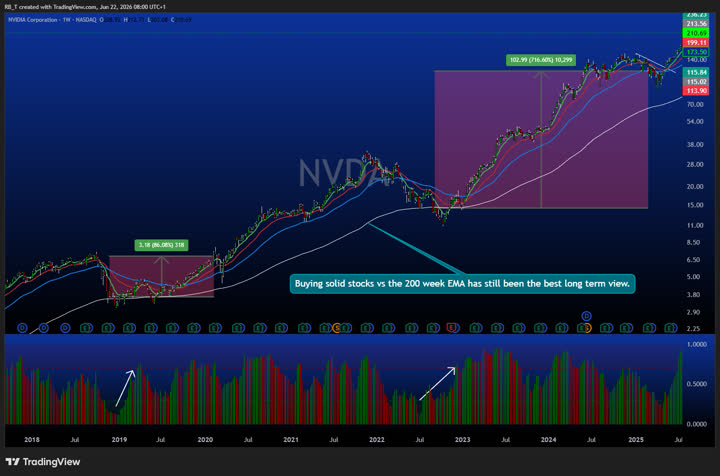
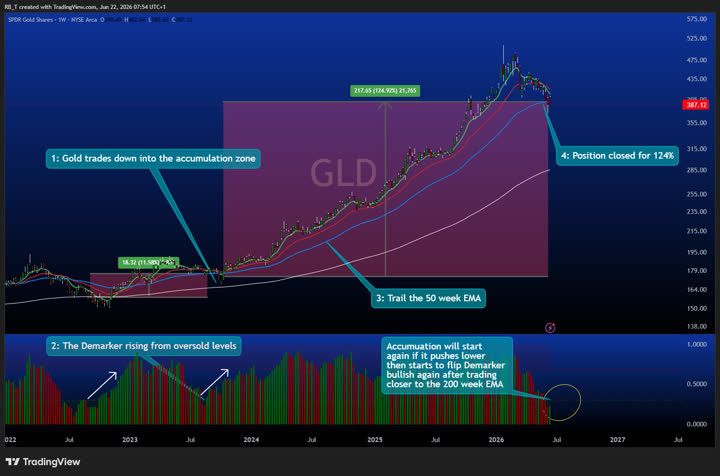
This is a separate, long-term portfolio strategy — completely different to the EMA Swing setups, which are short-term trades read off the daily chart. Here we accumulate quality assets for the long run when they pull back to the 200 week EMA, only when the 50W EMA is above the 200W (confirmed weekly uptrend). Proximity is judged in each asset's own weekly volatility (ATR), so "close to the line" means the same thing whether it's a calm bond fund or volatile crypto. Build positions slowly, never use leverage, trail your stop below the 50W EMA and scale out at the targets. Click any row for its live weekly chart.
How to read this section
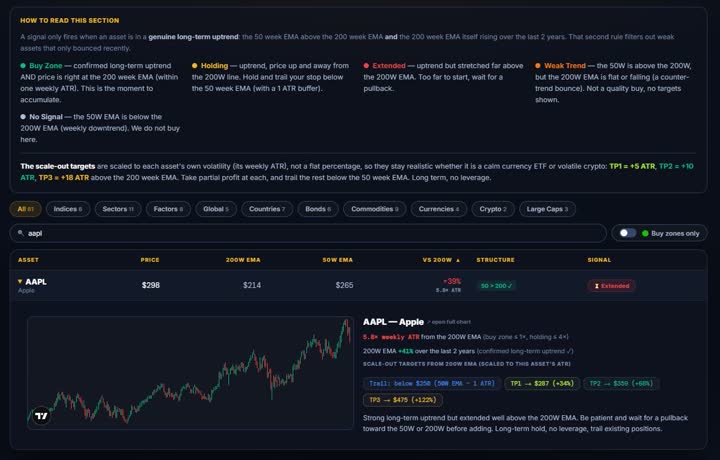
A signal only fires when an asset is in a genuine long-term uptrend: the 50 week EMA above the 200 week EMA and the 200 week EMA itself rising over the last 2 years. That second rule filters out weak assets that only bounced recently.
The Score column — entry quality right now, not company quality
Five checks. 5/5 is the moment to start accumulating, not a verdict on the business:
1  50W EMA above the 200W — long-term structure intact
2  Price within 1× weekly ATR of the 200W — either side
3  No more than 2× ATR above — you are not chasing
4  No more than 2× ATR below — not a falling knife
5  Weekly DeM under 0.30 — momentum washed out, so the zone touch is likelier to hold
Why a stock that has fallen further can score lower. Being down a long way is not the same as being at the zone. A name well under its 200W has usually broken its trend rather than gone on sale — so it loses marks for the same reason one that has run too far above does. The score is looking for price sitting at the 200W, whichever side it arrives from.
A low score is not "bad company" — it is "not your entry today". A great business that has run 30% above its zone still scores low. Hover any score to see which checks it passed and failed.
Buy Zone — confirmed long-term uptrend AND price is right at the 200 week EMA (within one weekly ATR). This is the moment to accumulate.
Holding — uptrend, price up and away from the 200W line. Hold and trail your stop below the 50 week EMA (with a 1 ATR buffer).
Extended — uptrend but stretched far above the 200W EMA. Too far to start, wait for a pullback.
Weak Trend — the 50W is above the 200W, but the 200W EMA is flat or falling (a counter-trend bounce). Not a quality buy, no targets shown.
No Signal — the 50W EMA is below the 200W EMA (weekly downtrend). We do not buy here.
The scale-out targets are scaled to each asset's own volatility (its weekly ATR), not a flat percentage, so they stay realistic whether it is a calm currency ETF or volatile crypto: TP1 = +5 ATR, TP2 = +10 ATR, TP3 = +18 ATR above the 200 week EMA. Take partial profit at each, and trail the rest below the 50 week EMA. Long term, no leverage.
Sort
Scanning assets…
Asset Price 200W EMA 50W EMA vs 200W Structure Signal Score
Score = entry quality right now, not company quality. Five checks, 5/5 is the ideal moment to start accumulating: 1) 50W EMA above the 200W (long-term structure intact) · 2) price within 1× weekly ATR of the 200W — either side · 3) no more than 2× ATR above it (not chasing) · 4) no more than 2× ATR below it (not catching a falling knife) · 5) weekly DeM under 0.30 — momentum washed out, so the zone touch is more likely to hold.
Why a stock that has fallen further can score lower: being down a long way is not the same as being at the zone. A name well under its 200W has usually broken its trend rather than gone on sale, so it loses marks for the same reason one that has run too far above does. The score wants price at the 200W, whichever side it arrives from.
A low score is not "bad company" — it is "not your entry today". Hover any score to see which checks it passed and failed.
Member rate
RB Trading Pro Journal
10% Off · Code RBTFX
FunderPro Funding
RB Trading
3-Step Trading Education
$15 Gift
TradingView Subscription
Free Indicator
DeM Trend Bias & Strength
Free Tool
Position Size Calculator
Community
RB Trading Discord
Crypto Safety
Ledger Hardware Wallet
Prop Firms We Trade With
RB Trading — for paid members only. Not financial advice. Always manage your own risk.
rbtrading.substack.com